

As it becomes clear that home sales and prices in the Greater Toronto Area (GTA) are declining, industry professionals are trying to figure out what lies ahead.
How severe and how long will the decline be? Will it be a “soft landing” for the high-flying housing market or a “hard landing” that will resemble the one that happened in 1989?
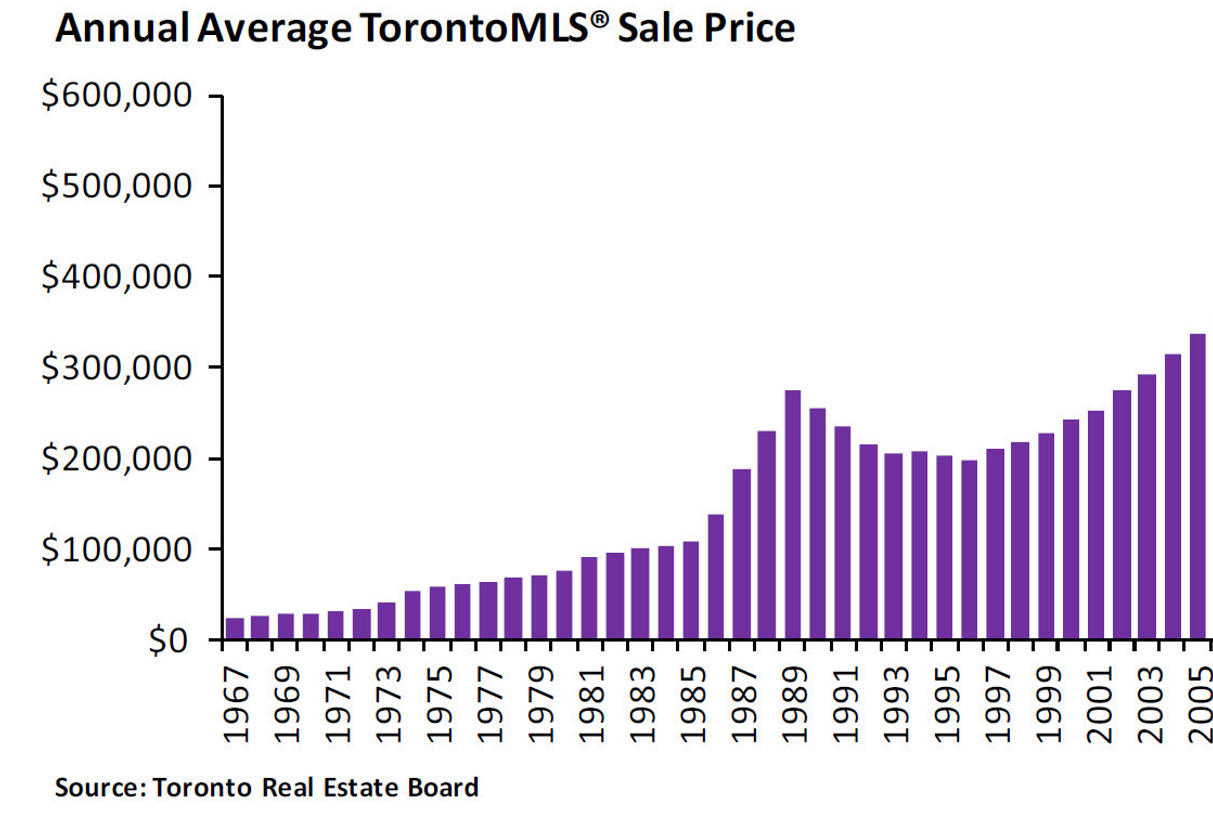
It is worth remembering (see chart below) that after 1989, home prices kept declining for seven long years and lost roughly 30% of their value during that period. Furthermore, it took 13 years for prices to recover to the 1989 peak (reached again in 2002).
However, in 1989 mortgage rates were in the double digits, and soon afterwards the economy entered a prolonged recession. Neither of those two factors seem to be relevant today, which suggests that a long period of declining home prices in the GTA is less likely.
In contrast to predicting highly uncertain long-term trends in real estate markets, forecasting short-term prospects seems more realistic, especially given the wealth of available data.
The latest statistics from the Toronto Regional Real Estate Board (TRREB) show that home sales were 39% lower in May this year compared to a year ago. The year-over-year declines in sales actually started in mid-2021, but they became steep only in the last three months (see chart below).

The average home price peaked in February of this year and then declined by roughly 3 percent in each of the following three months (see chart below).

However, past sales and prices do not tell us much about the future. A better predictor in that regard is a leading, nevertheless under-utilized, indicator – the sales-to-new-listings ratio, i.e., the ratio of demand and supply for homes.
When this ratio is, say, 60%, it simply means that in a given month there are 60 sales for every 100 new listings. Traditionally, a ratio in the 40% to 60% range is considered a sign of a “balanced” market, while ratios above or below that range indicate a “seller’s” and “buyer’s” market, respectively.
The sales-to-new-listings ratio in the GTA was in the seller’s range (above 60%) throughout 2021, reached above 80% in the second part of the year, and even went above 100% in the last month of 2021 (see chart below).

However, right from the start of 2022, as sellers remained optimistic while buyers became skeptical, the sales-to-new-listings ratio started a steep and steady decline that ended at 39% in May – buyer’s market territory. Thus, in only a few months, the GTA housing market went almost straight from a seller’s to a buyer’s market.
As any student of economics will tell you, when supply is rising and demand is declining, prices are bound to fall. But, this year’s fall in home prices did not start at the same time as the decline in the sales-to-new-listings ratio. There was a three-month delay as the sales-to-new-listings ratio started to fall in January, while the average home price started to decline in March.
Clearly, it took a few months for sellers to realize that the demand they counted on was not there anymore and for buyers to learn that they now had enough negotiating power to push down prices.
Even if the sales-to-new-listings ratio starts to recover in the coming summer months, which is far from likely, it will most probably remain near the bottom of the balanced 40% to 60% range. This suggests that, at least for the next few months, there will be continued downward pressure on home prices.
Whether this pressure extends into the fall and becomes a prolonged trend depends to a great degree on the future direction of the sales-to-new-listings ratio. Past trends indicate that this ratio, as well as average prices, usually decline mildly during the summer months.
If we discount this regular seasonal trend, then the only year of the last two decades when the ratio started to decline during the traditionally strong early spring months was 2017. In that year, the ratio declined from a strong seller’s 80% level in February to a buyer’s 40% level in June – a four-month decline. This was followed, with a few months’ delay, by a decline in average prices that lasted practically until the end of the year.
If this experience is any guide, and barring any external (political, social, financial) shocks to the system, it seems reasonable to expect continued home price weakness in the second part of this year.
This would be good news for the Greater Toronto Area, as it would bring a soft landing, rather than a crash, to the clearly overheated housing market.
