
By: David Moadel

Last Updated:
As economic uncertainty looms and recession concerns mount, the need to save for a rainy day – or perhaps a rainy year or longer – comes into sharp relief in 2022. Indeed, the need to save is more starkly evident now for American individuals and families than it’s been in quite a while. These savings statistics will give you an idea of how Americans are responding.
Are Americans actually saving their money in 2022, though? It’s a crucial question as the health of the economy depends not only on spending activity but also on people having enough cash to cover basic expenses and life’s unexpected calamities. With that in mind, consider the following 21 fascinating facts – plus a couple of bonus stats thrown in for good measure – as America grapples with an under-reported yet nonetheless critical savings crisis.
Essential Savings Data
% of Household with No Emergency Savings
- 23% of households self-reported having no emergency savings at all[1]. That’s down from 25% last year, and it’s among the lowest levels recorded during the 12 years that Bankrate has conducted this poll.
- Compared to older generations, Millennials (ages 26-41) have significantly less in savings. 62% of Baby Boomers (ages 58-76) have the ability to cover three months’ worth of expenses, while 47% of Generation X-ers (ages 42-57) and only 40% of Millennials have this ability[1].
- The most recent data available from the Federal Reserve Board’s Survey of Consumer Finances found that the median savings balance of Americans under the age of 35 was just $3,240, while the average was $11,200. From ages 55 to 64, the median increased to $6,400 while the average rose to $57,800[2].
🤔 Average and Median: What’s the Difference?
What are averages and medians, and why are they so different?
The average is calculated by adding up the individual values and then dividing by the number of individual values. It can be skewed upwards by a small number of very large values.
The median is the mid-point value of the set, where half the values in the set are smaller and half are higher. It is less likely to be distorted by a few very large or small values.
% of Americans Who Would Not Be Able to Cover An Unexpected $1,000 bill
- Bankrate-sourced data from January of 2022 revealed, shockingly, that 56% of Americans would be unable to cover an unexpected $1,000 bill with their savings at that time[2].
- Northwestern Mutual’s 2022 Planning & Progress Study determined that the average personal savings, not including investments, was $62,086[2].
- The U.S. personal savings rate – or the percentage of disposable income consumers save – dipped to 5.1% in June 2022, according to the St. Louis Federal Reserve. That figure was 8.7% in December 2021, and 14% in December 2020[3].

- Ted Rossman, senior industry analyst at Bankrate, recommends having three to six months’ worth of expenses stored for emergency savings. Personal savings expert Suze Orman says eight to 12 months’ worth is better.
- Vanguard’s “How America Saves 2022” report states that Americans, on average, have approximately $141,542 saved in the company’s retirement funds[4]. But again, averages can be deceiving: the median balance was found to be just $35,345.
Takeaway: Certain stats might be skewed in a more positive-sounding direction, but make no mistake about it: Too many Americans are woefully under-saved and under-prepared for a financial emergency.
Americans’ Dwindling Savings
- Stimulus efforts from the U.S. government in the wake of COVID-19 likely had a positive effect on Americans’ ability to save money. That effect may have worn off by 2022. In January, Americans saved only 6.4% of their after-tax income; the pre-pandemic level was 7%[5].
- In February of this year, only 16% of survey respondents said they had more in savings than before the COVID-19 pandemic. Even worse, 50% said they had less saved up than they did pre-pandemic[5].
The stats were even more startling for lower-income U.S. households. Among them, only 9% said they had more in savings than they did prior to the pandemic, and 64% actually said they had less. - It seems that many Americans, for better or for worse, are dipping into their savings. A GOBankingRates study of 1,000 adults determined that 35.54% of respondents had tapped their savings as their purchasing power diminished due to the impact of inflation[6].
Not everyone tapped their savings equally, though. While 18% of study participants aged 55-64 had dipped into their savings in order to deal with high inflation, a whopping 52% of 18- to 24-year-olds did so.

Takeaway: Stimulus measures from the government can help in the short term, but ultimately, Americans must rely on their own proactive savings habits to get through financially challenging times.
Perceptions and Issues Among U.S. Savers
- A nationwide survey of 1,025 adults, courtesy of Bankrate, found that 58% of the respondents said they’re concerned about the amount they have in emergency savings. That figure is up from 48% in 2021 and 44% in 2020. Out of the 58% in the most recent survey, 32% said they’re “very uncomfortable” with their level of savings[1].
- Overall, Millennials aren’t very comfortable with their current savings. Thus, the level of comfort with one’s savings amount stands at 49% for Baby Boomers, 41% for Generation X-ers, and just 38% for Millennials[1].
- A February poll from The New York Times and Momentive determined that 35% said they were just managing to make ends meet financially[7]. Meanwhile, 12% were drawing on their savings, and 13% were running into debt. Only 9% of the participants self-reported saving “a lot”, while 29% were saving “a little.”
- Education apparently makes a difference, as 53% of college graduates self-reported to be savers, compared to 31% of those who have attended some college or earned a high school diploma.
- Gender might play a role, as well, with 43% of men reporting that they’re saving, compared to 34% of women.
Takeaway: Many Americans aren’t ultra-comfortable with their savings, and some of those who should be saving the most are, unfortunately, saving the least.
Savings and Retirement Planning
% of Americans who are saving for retirement
- A survey, courtesy of TransAmerica Center, revealed that 77% of American workers were saving for retirement through employer-sponsored retirement plans and other options.
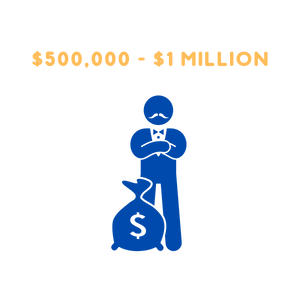
- Experts suggest that to continue living at or near the lifestyle you’ve had while working, you’ll need between $500,000 and $1 million saved to finance your retirement years.
% of Americans who don’t know exactly how much they need to save for retirement
- Perhaps we’re not thinking about specific savings calculations like we ought to. The Retirement Industry Trust Association reports that 43% of workers only guess how much savings they’ll need to retire[8], instead of basing it on their current expenses or using a retirement calculator.
Takeaway: It’s never too early or too late to save for your golden years, and informed calculation is almost always better than mere guesswork or simply ignoring the topic altogether.
If these savings statistics are startling, then let them inspire you to plan and prepare for life’s challenges, and for a more comfortable retirement, by saving more whenever it’s feasible. There’s no need to wait for the U.S. Congress to come to the rescue if you’re able to build a cash cushion over time, and thereby help ensure a more secure future for yourself and your family.
Last Updated: September 21, 2022
The content on finmasters.com is for educational and informational purposes only and should not be construed as professional financial advice. Finmasters is not a financial institution and does not provide any financial products or services. We strive to provide up-to-date information but make no warranties regarding the accuracy of our information.
