
Yesterday (March 7, 2023) two big things happened. The first is that I got a lovely bunch of sunflower blooms for my birthday present. Which was ace. The second, the RBA Board wheeled out the governor to announce the 10th consecutive interest rate rise even though inflation has been falling for several months. The RBA has now become preposterous and the Government should definitely terminate the tenure of the Governor in September when his term is up for renewal. In the meantime, it should clean the RBA Board out, or introduce legislation that says each member including the governor gets the real disposable loss that they are imposing on the worker deducted in percentage terms from their own salaries. A further deduction would be made (quantum to be determined) for each percentage point the unemployment rate rises. That might give them pause for thought. The music segment will definitely lift your spirits after reading through the following gloom.
Huge losses in average real household disposable income – deliberately engineered by the RBA
I will come back to the RBA decision yesterday soon.
As part of the publication suite that follows the monthly Board meeting, the RBA releases a – The Australian Economy and Financial Markets Chart Pack March 2023 (released March 8, 2023).
The pack contains all sorts of information about the economy which the RBA claims is used to justify the interest rate decision released the day before.
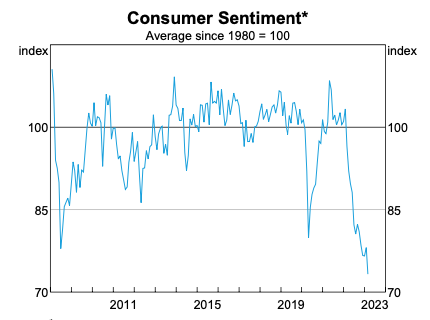
This graph (taken from the pack) shows the collapse of Consumer Sentiment since the rate rises began 11 months ago.
The GFC and pandemic was bad enough, but the RBA has engineered something shocking.
Bear that in mind when I analyse the decision.
The next graph shows the impact of the decisions on Household consumption expenditure, Household disposable income and the Household saving ratio.
The only reason that consumption expenditure has been maintained is because households are now saving much less of their disposable income.
Remember this is an aggregate depiction of the situation.
For many low income households who had low to zero saving stocks and a low capacity to save given their incomes, they will be in deep water now eating into what little wealth they might have or going towards insolvency.
At the other end of the wealth scale, the top-end-of-town will be banking the interest rate rises and the boost to their incomes courtesy of the RBA-engineered massive income and wealth redistribution.
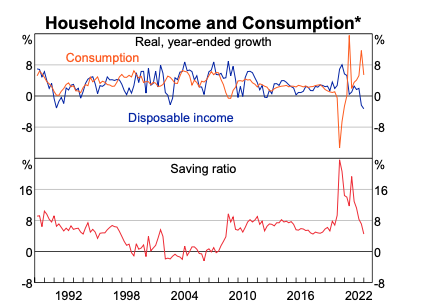
The graph also shows disposable income is now in decline in aggregate.
The RBA conveniently show the nominal disposable income and fail to adjust for population growth.
Even in those terms, the situation is poor and getting worse.
But I did an adjustment for the movement in consumption prices, using the Household Final Consumption Expenditure implicit price deflat0r which was published in last week’s National Accounts for the December-quarter 2022.
I also corrected for population growth to get a real Household disposable income per capita measure and the next graph which is my construction shows the annual change in that measure which can thus be contrasted to the RBA’s measure in the previous graph.
Over the 12 months to December 2022, real Household disposable income per capita has fallen by 4.9 per cent, which is a disastrous decline commensurate with the deepest recessions in recent history.
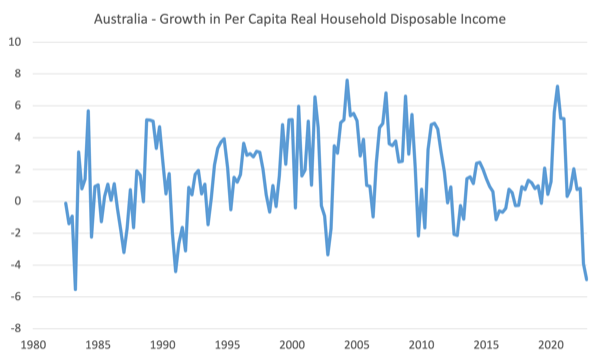
The graph covers the 1982 recession – real Household disposable income per capita fell by 5.53 per cent (June 1982-June 1983); the 1991 recession (the worst since the Great Depression) – fell 4.39 per cent (March 1990-March 1991); the GFC – fell 2.17 per cent (December 2008-December 2009); and the pandemic – no decline due to the fiscal support for households.
So apart from the 1982, the current period is delivering the worst cuts in real Household disposable income per capita and the situation will decline further in the coming months.
Remember also that that that aggregate figure masks the distributional effects across the income scales.
The cuts to low income households with mortgages will be far greater than this.
The RBA is creating a disaster for families in this country.
They are unaccountable and unelected and the government should intervene and put a stop to the rate rises and sack the governor and his Board.
The RBA decision and justification
While I was stretching this morning after running, the RBA governor turned up on the TV screen trying to justify the unjustifiable.
He smugly told us that inflation was the worst problem that we could have and while he didn’t want unemployment to rise, the RBA would push unemployment as high as was necessary to bring the inflation rate back to to between 2-3 per cent.
He spoke a lot about the ills of inflation but hardly said a word about the devastating effects of unemployment on a society.
By any stretch unemployment is the worst of the twin evils.
Losing a job, then a home, then all your savings, then, in many cases, your family, and your physical and mental health – all part of the unemployment story, not to mention the destruction of self-esteem and confidence – are far worse than being squeezed by some price rises.
Especially when the current inflation is abating anyway because the factors that created the pressures are being sorted out.
That abatement has nothing to do with the interest rate rises.
In the – Statement by Philip Lowe, Governor: Monetary Policy Decision (released March 7, 2023) – the RBA is oblivious to the damage it is deliberately causing.
First, in raising the cash rate target again, it also raised “the interest rate on Exchange Settlement balances”.
For those who don’t know, the ES balances are what Americans call bank reserves.
They are the accounts the commercial banks have to keep with the RBA to facilitate the payments system.
At present, the accounts are in excess as a result of the RBA’s government bond buying spree during the pandemic.
So, not only is the RBA punishing mortgage holders through the higher rates, the flow on to the support rate they are paying the banks on their ES balances are providing an income bonanza to the bank shareholders, who are typically high income and high wealth citizens.
This redistribution from poor to rich is in addition to the basic redistribution coming via the interest rate impacts on wealth holdings.
The RBA admits that:
The monthly CPI indicator suggests that inflation has peaked in Australia.
It has been in decline for a few months now.
They also admit that:
Medium-term inflation expectations remain well anchored …
Which is RBA-speak that everyone understand the inflation at present is supply-driven and those drivers are in decline and inflation is dropping.
How come citizens intuitively have understood the inflation is transitory while the policy makers keep beating up that it could create a wage-price spiral and has to be knocked on the head with the biggest sledge hammer they can bring to bear?
The RBA admit that:
Growth in the Australian economy has slowed, with GDP increasing by 0.5 per cent in the December quarter and 2.7 per cent over the year. Growth over the next couple of years is expected to be below trend.
Read: well below trend.
By the March-quarter, GDP growth will be well below 2 per cent and declining.
Trend growth is around 3.2 to 3.5 per cent.
Anything less than that will see unemployment rise quickly.
The RBA abuse history:
The labour market remains very tight, although conditions have eased a little. The unemployment rate remains at close to a 50-year low.
Yes it does.
But the reference period is flawed.
The 50-year time period mentioned is really the neoliberal period where the unemployment rate has been deliberately held at elevated levels by flawed monetary and fiscal policy.
So saying that we are back to where this ugly period of history began is saying nothing good.
Why not pick a 60-year period?
That will take us back to the true full employment period when unemployment rates were below 2 per cent, not 3.7 per cent as they are now.
Further, in the full employment period, there was little underemployment.
At present, underemployment is at 6.1 per cent and on average the underemployed want around 14 extra hours of work per week.
So the broad labour underutilisation rate (unemployment and underemployment) is 9.8 per cent – that means the Australian labour market is not very tight at all and many hours of work short of full employment.
The RBA governor had the audacity to claim we were at full employment on TV this morning.
I nearly pulled a muscle stretching when he said that.
The RBA maintained the ‘fear’ of a distributional struggle, which they are now terming a price-wage spiral.
Apparently, their private data from their interviews with corporations is still showing what all the official data is not – that there is dangerous wage pressure.
They should release this data and allow experts like me interrogate the basis of it.
My bet is that the corporations are spinning a story because the managers benefit from interest rate rises in some way.
None of the public data released by the ABS is showing anything other than growing and large real wage cuts and low nominal wages pressure.
Finally, the RBA acknowledged that:
… monetary policy operates with a lag and that the full effect of the cumulative increase in interest rates is yet to be felt in mortgage payments. There is uncertainty around the timing and extent of the slowdown in household spending.
In effect, the RBA as in the case of all central banks have no real idea of when these changes will impact, how they will impact and who they will benefit and hurt the most.
The fact that they are just pushing on with rate rises, when there are so many indicators suggesting: (a) the inflation is transitory and in decline; and (b) low income households are going broke; and (c) eventually the rate rises will create a recession and drive up unemployment which will make matters worse – is indefensible.
The RBA have been in this position before – on both sides of the dynamic – rate falls too late, rate rises too early and too many.
What that means is that monetary policy is not a good tool for counter stabilisation.
So while the RBA is mimicking the US Federal Reserve in its madness, we do, thankfully, have an alternative approach.
The Bank of Japan is not lifting rates and the Cabinet Office is protecting households from cost-of-living pressures with fiscal transfers.
Why are they doing that? Because they understand the inflation is transitory and they don’t want to create other problems by pushing up unemployment and driving mortgage holders broke.
In its most recent – Outlook for Economic Activity and Prices (January 2023) – the Bank of Japan noted that:
The year-on-year rate of increase in the consumer price index … is likely to be relatively high in the short run due to the effects of a pass-through to consumer prices of cost increases led by a rise in import prices. The rate of increase is then expected to decelerate toward the middle of fiscal 2023 due to a waning of these effects, as well as to the effects of pushing down energy prices from the government’s economic measures …
The rate of increase, however, is expected to decelerate to a level below 2 percent toward the middle of fiscal 2023
And they said there would be no change in monetary policy settings.
We will see how that all turns out.
Music – Nina Simone
This is what I have been listening to while working this morning.
I only wish someone could put a spell on the RBA.
Here is – Nina Simone – with her version of the classic song – I Put a Spell on You – which was the title track of the 1965 album – I Put a Spell on You.
It is one of my favourite albums and I play it a lot.
The song was written by – Screaming Jay Hawkins
Nina Simone’s guitarist was – Rudy Stevenson.
Anyway, if anyone can work out how to cast a spell on the RBA that stops their madness let me know!
That is enough for today!
(c) Copyright 2023 William Mitchell. All Rights Reserved.
