
Last night (May 9, 2023), the Australian government delivered the latest fiscal statement (aka ‘The Budget’), and, in doing so guaranteed that unemployment would rise. A deliberate act of sabotage of living standards for disadvantaged Australians. All the hype was about the miniscule fiscal surplus that was announced as if it is some sort of badge of honour that politicians aim for. If they went to the homes of the poor; if they visited the public hospital system that is still straining under Covid etc and years of fiscal neglect; if they examined the state of climate science; and if they just opened their eyes generally, they would see that a fiscal surplus is an indication at this stage in our history of deliberate neglect of the main challenges of the day. Sure enough, the Government handed out some dollops of cost-of-living relief to low-income families – a few pennies in the scheme of things. But while recording a surplus they still refused to lift the unemployment benefit recipients above the poverty line and ensured their would be more of the same forced to live in poverty. The priorities are all wrong and this is another neoliberal-lite effort from the Labor Party.
The cruel failure to acknowledge the unemployed
In ‘Budget Paper No.1’, Statement 2: Economic Outlook, we observe the following forecasts.
| Aggregate | 2022 (Actual) | 2023 | 2024 | 2025 |
| GDP growth | 3.60 | 1.75 | 1.50 | 2.75 |
| Unemployment | 3.80 | 3.50 | 4.25 | 4.50 |
| Participation rate | 66.60 | 66.50 | 66.25 | 66.25 |
| Inflation | 6.50 | 6.00 | 3.25 | 2.75 |
The Treasury also indicate that population growth will be “2 per cent in 2022-23 and 1.7 per cent in 2023-24”.
Participation is forecast to fall marginally.
Note the forecasts in the Table are for calendar years and the population growth predictions are for fiscal years.
If we assume the labour force grows in line with the assumed underlying population forecasts then it is hard to see how the unemployment rate increase can be confined to a forecasted 0.7 points over the period to 2025.
The famous US economist Arthur Okun developed a rule of thumb about the way unemployment reacts to GDP growth.
The rule of thumb has it that if the unemployment rate is to remain constant, the rate of real output (GDP) growth must equal the rate of growth in the labour force plus the growth rate in labour productivity.
Remember that labour productivity growth reduces the need for labour for a given real GDP growth rate while labour force growth adds workers that have to be accommodated for by the real GDP growth (for a given productivity growth rate).
If we assume that productivity growth is around 1.5 per cent (a long-term trend value) and the labour force grew at 2.0 per cent, then 1.7 per cent for the next two years after 2022-23, then GDP growth has to be 3.5 per cent for the current fiscal year, then 3.2 per cent for the years 2023-24 and 2024-25.
A cursory look at the Table above, shows the following:
1. 2023-24 – GDP will be at least 1.4 points below the required rate to keep the unemployment rate constant.
2. 2024-25 – GDP will be at least 1.1 points below the required rate.
3. So the cumulative rise in the unemployment rate under these assumptions would be 2.5 per cent not 0.7 per cent.
The only way that the unemployment rate will rise by 0.7 points over the next three years is if productivity growth is around zero if not negative.
My best guess (based on a simulation) is that unemployment will rise from 507 thousand as at March 2023 to around 685 thousand by June 2025 under current trends (tighter monetary policy and fiscal austerity).
That will deliver a 4.5 per cent unemployment rate and will mean an extra 178 thousand workers will be deliberately rendered jobless by the government’s own forecasts.
That in itself is an appalling scenario for a government to engineer especially when recording a fiscal surplus.
In this blog post – The so-called Inclusion Committee that recommends keeping the unemployed impoverished (April 19, 2023) – I updated my estimates of how far below the poverty line the unemployment benefit recipients are.
I showed that a single unemployed person on unemployment benefits was $181.25 per fortnight below the current poverty line.
A 26 per cent increase on the current benefit level would be required to push them up to that line.
In last night’s fiscal statement, the Government, reluctantly (it has been under extreme pressure to lift the rate), raised the rate by just $40 per fortnight.
So while deliberately planning to increase the jobless numbers by around 180 thousand, the policy of this government is to leave the unemployed around $141 per fortnight below the poverty line.
It is often said that we should judge a society by how it treats its most disadvantaged rather than how rich people become.
On that benchmark, the Australian government is failing.
The prime minister tried to whitewash this by claiming that last night’s statement was:
… a budget that didn’t leave people behind.
That is a categorical lie.
Massive fiscal contraction continuing
The fiscal shift from one year to another is the change in the fiscal balance as a percentage of GDP changes.
It provides an idea of how expansionary or contractionary the current fiscal position relative to the previous financial year.
It is the result of two factors – the fiscal balance itself (in $As) and the value of nominal GDP (in $As).
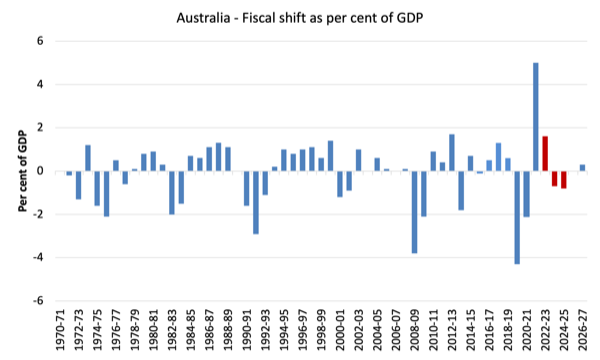
The following graph shows the recent history (from 1970-71) of fiscal shifts up to the end of the projection period (2026-27).
I have coloured the current fiscal year (2022-23) green (it will be fairly close to the actual revealed next month) and the remaining red columns are the forward estimates for next year (2023-24) and those beyond.
A positive value indicates a move to austerity (even if the fiscal position is still in deficit) and vice versa.
As you can see the shift to austerity in 2021-22 was large (a 5 per cent of GDP shift) as the Government abandoned the pandemic support.
In the first full year of the current Government (elected May 2022), the contraction continues, with the Government taking a further 1.6 per cent of GDP out of the economy and recording a 0.2 per cent of GDP fiscal surplus overall.
At the same time as the RBA has hiked interest rates 11 times since May 2022, this degree of fiscal contraction is the reason that GDP growth is now projected to be at levels where the unemployment rate rises significantly.
The Government claims it has provided “a $14.6 billion cost-of-living relief package” targetted at low income workers and their families, the reality is that a fiscal contraction of this size will undermine the welfare of those families, many of who will see breadwinners lose their jobs as a result of the deliberately contrived slowdown in growth.
And that is not to mention the lack of spending on strategies to deal with climate change and the housing crisis in this country.
Where is the growth coming from?
The 2023-24 fiscal statement forecasts that real household consumption expenditure will grow by 1.5 per cent in 2023-24 and 1.5 per cent in 2024-25.
The following graph shows the annual Household consumption expenditure growth from 2009-10 to 2024-25, with the red bars capturing the Government’s projections.
You can see that after the consumption boom in the current fiscal year as households adjust back as the pandemic eases (a bit), is followed by rather slower growth, which is consistent with the significantly reduced GDP growth forecasts.
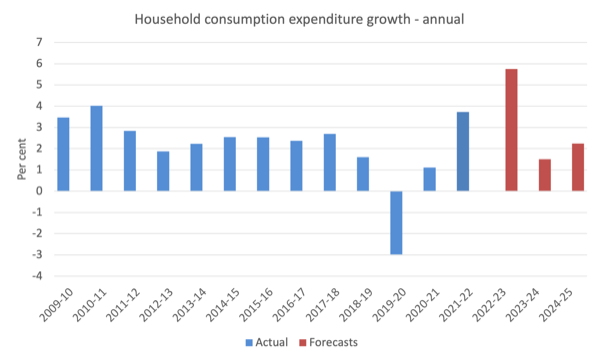
I suspect the forward estimates of household consumption expenditure will be excessively optimistic.
Why?
Because the projected wages growth is overly optimistic given current trends and the delayed impact of the RBA interest rate hikes and the fiscal contraction underway.
Wages growth has been at record low levels even with the relatively low unemployment rates.
With the unemployment rate forecast to rise significantly it is hard to see wages growth breaking out of that trend in any substantial way.
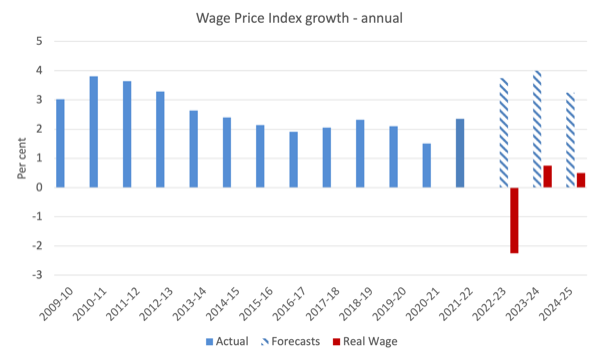
There will be some wages growth but nothing like that projected in the fiscal statement (see the next graph).
Even with those optimistic nominal wage growth projections, real wages will fall substantially in the current fiscal year and only slightly record growth in the next two years.
I suspect that nominal wages will not grow as much as forecast, which means that the real wage gains in the next two years, already forecast to be miniscule, will probably disappear.
That leaves further credit growth to drive growth in consumption expenditure and with household debt at record levels and interest rates much higher than a year ago, I cannot see that happening.
Why the government strategy is unsustainable
We know that the financial balance between spending and income for the private domestic sector (S – I) equals the sum of the government financial balance (G – T) plus the current account balance (CAB).
The sectoral balances equation is:
(1) (S – I) = (G – T) + CAB
which is interpreted as meaning that government sector deficits (G – T > 0) and current account surpluses (CAD > 0) generate national income and net financial assets for the private domestic sector to net save overall (S – I > 0).
Conversely, government surpluses (G – T < 0) and current account deficits (CAD < 0) reduce national income and undermine the capacity of the private domestic sector to accumulate financial assets.
Expression (1) can also be written as:
(2) [(S – I) – CAB] = (G – T)
where the term on the left-hand side [(S – I) – CAB] is the non-government sector financial balance and is of equal and opposite sign to the government financial balance.
This is the familiar Modern Monetary Theory (MMT) statement that a government sector deficit (surplus) is equal dollar-for-dollar to the non-government sector surplus (deficit).
The sectoral balances equation says that total private savings (S) minus private investment (I) has to equal the public deficit (spending, G minus taxes, T) plus net exports (exports (X) minus imports (M)) plus net income transfers.
All these relationships (equations) hold as a matter of accounting.
The government is estimating that the negative global factors will push Australia’s terms of trade from the 11.9 per cent increase recorded in 2021-22 to 1.5 per cent growth in 2022-23.
Then the forecast is for a massive contraction in the terms of trade of 13.25 per cent in 2023-24 and a further fall of 8.75 per cent in 2024-25.
In other words, the commodity price boom which has pushed the external balance into surplus recently is forecast to end and Australia will return to its usual position of a external deficit of around 3.5 to 4 per cent of GDP – a state that has been dominant since the 1970s.
We should note that the small fiscal surplus estimated for this fiscal year is largely the result of massive tax receipts coming to the government as a result of the commodities boom
The following graph shows the sectoral balance aggregates in Australia for the fiscal years 2000-01 to 2026-27, with the forward years using the Treasury projections published in ‘Budget Paper No.1’.
The projections begin in 2022-23 (although the current year’s results are probably going to be as forecast).
I have assumed that the external position in 2025-26 and beyond will be the same as the Government’s estimate for 2024-25.
All the aggregates are expressed in terms of the balance as a percent of GDP.
I have modelled the fiscal deficit as a negative number even though it amounts to a positive injection to the economy. You also get to see the mirror image relationship between it and the private balance more clearly this way.
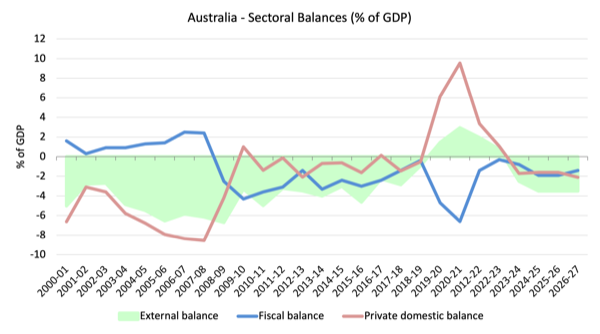
So it becomes clear, that with the current account deficit (green area) projected to return to a deficit of 2.5 per cent of GDP in 2023-24 (as a result of a sharp reversal in the terms of trade) and then 3.5 per cent in the subsequent years, the private domestic balance (solid red line) will head quickly into higher deficits as the projected government balance (blue line) moves to surplus (briefly) and then a small deficit after that.
You can see that the pandemic support from Government clearly allowed the private domestic sector to rebuild its saving buffers and reduce the precarity of its balance sheet (given the massive household debt).
In the earlier period, prior to the GFC, the credit binge in the private domestic sector was the only reason the government was able to record fiscal surpluses and still enjoy real GDP growth.
But the household sector, in particular, accumulated record levels of (unsustainable) debt (that household saving ratio went negative in this period even though historically it has been somewhere between 10 and 15 per cent of disposable income).
The fiscal stimulus in 2008-09 saw the fiscal balance go back to where it should be – in deficit. This not only supported growth but also allowed the private domestic sector to start the process of rebalancing its precarious debt position.
That process was interrupted by the renewal of the fiscal surplus obsession in 2012-13.
You can see the red line moves into surplus or close to it and the private domestic deficit increases as a result of the liquidity squeeze.
The strong fiscal support during the pandemic overwhelmed all the nonsensical deficit scaremongering and allowed the private domestic sector to increase its overall saving (and pay down debt) which was a good thing.
But as the previous government withdrew its stimulus and the current government continued to pursue a contractionary fiscal position (see above), the private domestic sector has only one option given the trends in the external sector if it wants to maintain consumption expenditure – resume the process of accumulating more debt.
With a global recession threatening and interest rates rising sharply, the strategy outlined in yesterday’s fiscal statement is once again placing the economy on an unsustainable path relying on household debt accumulation, which is a finite process.
Conclusion
There are many other aspects to the current fiscal stance which I will analyse in the coming weeks.
In general, I am unimpressed.
That is enough for today!
(c) Copyright 2023 William Mitchell. All Rights Reserved.
