
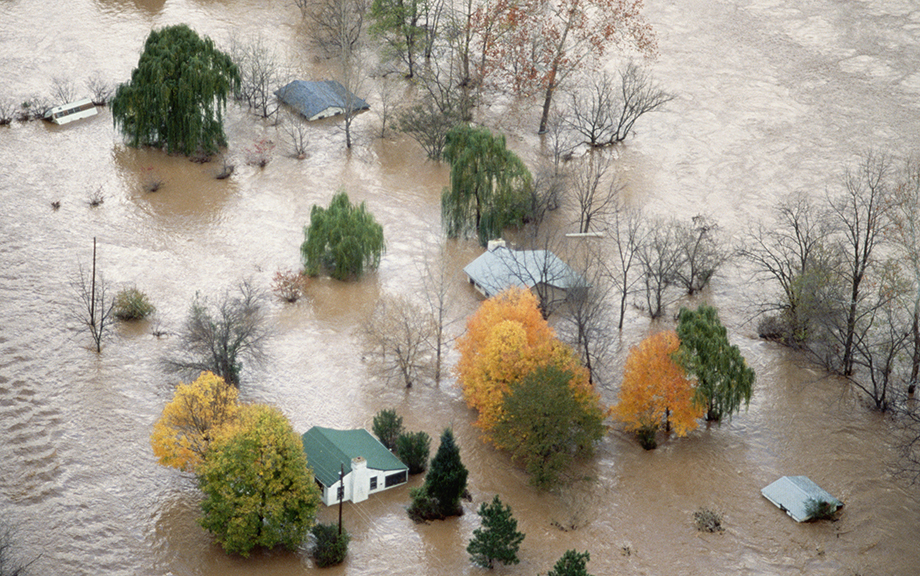
The National Flood Insurance Program (NFIP) was designed to reduce household and lender flood-risk exposure and encourage lending. In this post, which is based on our related study, we show that in certain situations the program actually limits access to credit, particularly for low-income borrowers—an unintended consequence of this well-intentioned program.
The National Flood Insurance Program
Congress established the NFIP in 1968 to “promote the public interest by providing appropriate protection against the perils of flood losses and encouraging sound land use by minimizing exposure of property to flood losses.” This followed evidence that post-disaster flood losses, and the subsequent federal disaster relief designed to help communities recover from those losses, were posing an increasingly larger burden on the nation’s resources.
The 1968 National Flood Insurance Act did not mandate community participation in the NFIP; instead, it gave communities the opportunity to participate in the program and obtain subsidized flood insurance with the completion of a Flood Insurance Rate Map (FIRM). A FIRM is an official map of the community. The map denotes the region that is considered a 100-year flood risk—the so called “Special Flood Hazard Areas (SFHAs).” These are parts of a community that have a chance of flooding “at least” once in 100 years (for detailed discussion of 100-year flood risk, see here or here). Communities that opted to join the program would adopt and enforce floodplain management standards aimed at reducing flood damages.
Even though the 1968 Act did not mandate the purchase of flood insurance by homeowners, it denied disaster relief to persons living in a 100-year flood zone who could have purchased flood insurance but did not do so (see: Section 1314 of the Housing and Urban Development Act of 1968). Over time, Congress increasingly put pressure on communities and residents of flood risk zones to buy flood insurance. Starting in 1973, Congress mandated that federally regulated lending institutions (primarily chartered banks) could not make, increase, extend, or renew any loan on a property located in a SFHA without requiring flood insurance. Congress further expanded the insurance purchase requirement in 1994 to apply to mortgages underwritten by government sponsored enterprises (GSEs).
To attract enrollment in the program, the National Flood Insurance Act of 1968 stipulated that the occupants of structures built on floodplains would have their premiums subsidized. To further attract participation, rates for flood insurance were lowered in 1972 and again in 1974. However, the declining trend in insurance premiums began to reverse in 1981, when rates increased for the first time in the NFIP’s history. The Biggert-Waters Act of 2012 required the subsidies—that pre-FIRM properties enjoyed—to be progressively phased out. The act further eliminated subsidies for a range of properties, including any property purchased after the date of enactment. As a result, starting in the fall of 2012, prospective mortgage borrowers for residential properties in high-risk flood zones were required to buy flood insurance at unsubsidized rates. This led to a significant increase in the cost of flood insurance, with potentially adverse effects on the affordability of mortgage financing for low- and medium-income borrowers. The Homeowner Flood Insurance Affordability Act of 2014 partially reversed this trend. It alleviated the rate problem—but only to a certain extent as in most cases it still allowed policy premiums to rise by up to 18 percent per year until they reached their risk-based rates.
Combining Flood Maps and Lending Data
We investigate the effects of mandatory flood insurance by combining Home Mortgage Disclosure Act (HMDA) data, which includes detailed information on mortgage applications, with natural disaster data, as well as digitized FEMA flood maps. To this end, we digitize these flood maps and quantify the extent to which each U.S. census tract is considered to be at risk of 100-year floods. As discussed, any applicant in such a region is required to purchase flood insurance. We thereby create a unique dataset that details the coverage of—and changes to— nationwide flood maps for the years 2013-2021.
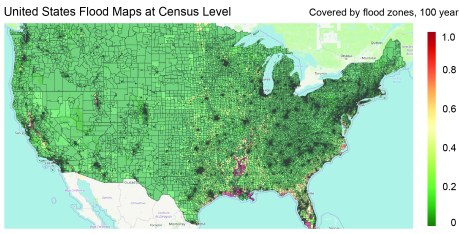
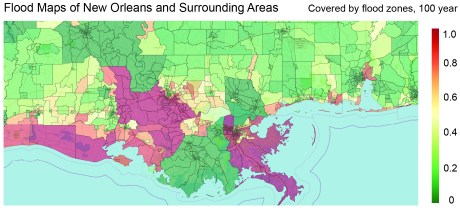
The pair of maps below depict the entire United States (top panel) and the area around New Orleans in Louisiana (bottom panel). Census tracts cover around 4,000 inhabitants and can vary in geographic size. Densely populated areas are very small and can be accurately categorized as being a flood-risk or not. In the maps, areas in dark red are considered to be 100 percent covered by flood zones. Areas in dark green, on the other hand, are at most 5 percent covered by a flood zone. By area, most of the U.S. is not considered a flood risk. However, the most populated regions lie along the coast or close to rivers—these census tracts are geographically small but numerous. Based on HMDA mortgage data, we estimate that over 40 percent of all mortgage applications for new single family (primary residence) homes in the U.S. over the past ten years occurred in census tracts that were at least partially covered by flood hazard zones. This represents more than 50 million new home purchase applications.
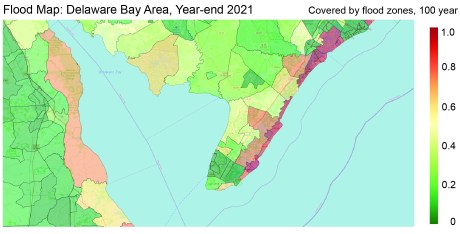
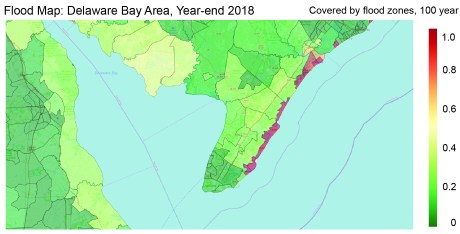
The next set of maps shows changes in flood zones around the Delaware Bay area between year-end 2018 and 2021. It is apparent that the later map shows a larger proportion of the area to be a “flood risk”—with the associated flood insurance mandate. A number of previously “safe” areas have been rezoned and are at least partially (in some cases substantially) covered by a flood hazard zone in 2021. It is unlikely that the underlying flood risk changes substantially within such a short period of time. The stark changes result from the fact that flood map updates are infrequent —FEMA attests to a long backlog of maps that require updating (for a discussion, see here). Map updates can increase the degree to which an area is considered at risk of flooding, or they can reflect efforts taken by the community to manage flood risk. In the latter case, the share of the census tract designated as prone to flooding can actually decrease. Map updates are somewhat more frequent in the years following a major disaster. However, even after a major disaster, an update usually takes several years to complete.
Using maps from the end of each year, between 2013 and 2021, we compute year-on-year changes in the proportion of a census tract that is covered by a flood map. Changes are bounded between -1 and 1. A change of 1 indicates that a census track was not covered by any flood map at the end of a given year, but is considered to be fully covered by a flood map the following year.
The fact that FEMA map updates can be slow is important for the purpose of our study. If we account for past flood damage as well as past FEMA maps in our analyses, then any discrete year-on-year map updates are conditionally independent of actual flood risk. After all, the underlying flood risk moves slowly, and the map updates can be sporadic, driven by available resources rather than a pure reflection of risk. Ultimately, the timing of any map update may be independent of actual risk, allowing us to disentangle the effect of an insurance mandate from the underlying flood risk.
Unintended Consequences of Mandatory Insurance
In our paper, we relate whether individual mortgage applications in a given census tract are accepted by a lender to changes in the degree to which the tract is covered by a flood map. We ultimately seek to quantify the reaction of banks and borrowers to suddenly being in a flood zone—and the insurance requirement that comes with this coverage.
We find that the chance of a loan application being accepted by a lender—as well as the size of loans that are accepted—are smaller in regions that experience a growth in the flood-zone coverage. Commensurate with the hypothesis that the costs of flood insurance reduce the ability of marginal households to borrow, we find that the reduction in lending is strongest for households with lower relative income and lower FICO scores, after accounting for the actual occurrences of flooding, the riskiness of a region, and borrower and bank characteristics. We perform a number of tests in our paper to ensure our results are picking up the effect of the insurance requirement as opposed to any effect that may be the result of underlying flood risk.
Although our results depict some negative—and likely unintended—consequences arising as a result of mandatory insurance requirements, it is worth noting that we do not speak to the overall welfare-effects of updating flood maps or of requiring insurance. However, since it seems socially undesirable to limit waterfront neighborhoods to the wealthy, our findings speak to the importance of factoring in affordability when introducing mandatory standards. When Congress passed the Homeowner Flood Insurance Affordability Act of 2014 it asked FEMA to develop a draft affordability framework. FEMA published its Affordability Framework in 2018 but has not implemented it because FEMA does not yet have the necessary funding.

Kristian Blickle is a financial research economist in Climate Risk Studies in the Federal Reserve Bank of New York’s Research and Statistics Group.

Katherine Engelman is a data scientist in the Data and Analytics Office in the Bank’s Technology Group.

Theo Linnemann is a data scientist in the Data and Analytics Office in the Bank’s Technology Group.

João A.C. Santos is the director of the Financial Intermediation Policy Research Division of the Bank’s Research and Statistics Group.
Disclaimer
The views expressed in this post are those of the authors and do not necessarily reflect the position of the Federal Reserve Bank of New York or the Federal Reserve System. Any errors or omissions are the responsibility of the authors.
