
Last Friday (May 5, 2023), the US Bureau of Labor Statistics (BLS) released their latest labour market data – Employment Situation Summary – April 2023 – which revealed continuing employment growth and and modest declines in unemployment. While the US Federal Reserve is deliberately trying to undermine the labour market, even though the inflation rate is falling relatively quickly, the April data suggests that the interest rate increases are not achieving the aim. There is no surprise there. Monetary policy is a relatively ineffective tool to suppress demand. Most of the aggregates are steady and in terms of the pre-pandemic period, March’s net employment change was still relatively strong. Real wages finally showed some improvement in the face of a decelerating inflation rate. Overall, the US labour market is steady and doesn’t appear to be contracting in the face of the Federal Reserve interest rate hikes.
Overview for April 2023 (seasonally adjusted):
- Payroll employment increased by 253,000 – slightly up on last few months.
- Total labour force survey employment rose by 139 thousand net (0.09 per cent).
- The labour force fell 43 thousand net (-0.03 per cent).
- The participation rate rose by 0.1 point to 62.6 per cent.
- Total measured unemployment fell by 97 thousand to 5,839 thousand.
- The official unemployment rate fell 0.1 point to 3.4 per cent.
- The broad labour underutilisation measure (U6) fell by 0.1 point to 6.6 per cent.
- The employment-population ratio was unchanged at 60.4 per cent (still well below the May 2020 peak of 61.2).
For those who are confused about the difference between the payroll (establishment) data and the household survey data you should read this blog post – US labour market is in a deplorable state – where I explain the differences in detail.
Some months the difference is small, while other months, the difference is larger.
Payroll employment trends
The BLS noted that:
Total nonfarm payroll employment increased by 253,000 in April, compared with the average monthly gain of 290,000 over the prior 6 months …
In April, employment continued to trend up in professional and business services (+43,000). Over the prior 6 months, the average monthly gain in the industry was 25,000 …
Employment in health care increased by 40,000 in April, compared with the average monthly gain of 47,000 over the prior 6 months …
Employment in leisure and hospitality continued to trend up in April (+31,000) … remains below its pre-pandemic February 2020 level by 402,000, or 2.4 percent.
In April, social assistance added 25,000 jobs, in line with the average monthly gain of 21,000 over the prior 6 months …
Employment in financial activities increased by 23,000 in April … Employment in financial activities changed little in the first 3 months of this
year.Government employment continued its upward trend in April (+23,000) … is below its February 2020 level by 301,000, or 1.3 percent.
Employment in mining, quarrying, and oil and gas extraction rose by 6,000 in April and has risen by 102,000 since a recent low in February 2021 …
Employment showed little change over the month in other major industries …
In summary, no sign of an impending recession although average monthly job creation in net terms is well down on 2022.
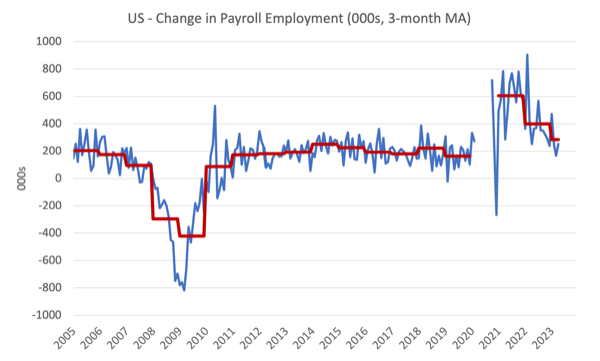
The first graph shows the monthly change in payroll employment (in thousands, expressed as a 3-month moving average to take out the monthly noise). The red lines are the annual averages. Observations between January 2020 and January 2020 were excluded as outliers.
Some sectors, however, have still not regained the employment they lost in 2020-21.
The next graph shows the same data in a different way – in this case the graph shows the average net monthly change in payroll employment (actual) for the calendar years from 2005 to 2023.
The red marker on the column is the current month’s result.
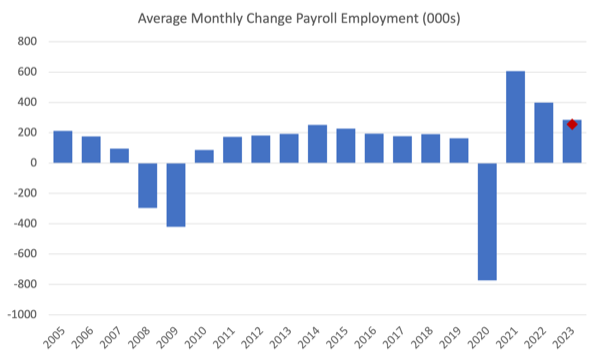
Average monthly change – 2019-2023 (000s)
| Year | Average Monthly Employment Change (000s) |
| 2019 | 163 |
| 2020 | -774 |
| 2021 | 606 |
| 2022 | 399 |
| 2023 (so far) | 285 |
Labour Force Survey data – employment growth slows
The seasonally-adjusted data for April 2023 reveals:
1. Total labour force survey employment rose by 139 thousand net (0.09 per cent) – significant weakening.
2. The labour force fell 43 thousand net (-0.03 per cent).
3.The participation rate was unchanged at 62.6 per cent.
4. As a result (in accounting terms), total measured unemployment fell by 182 thousand to 5,657 thousand and the official unemployment rate fell by 0.1 point to 3.4 per cent.
While there is no sign of recession so far, this month marked a weaker situation.
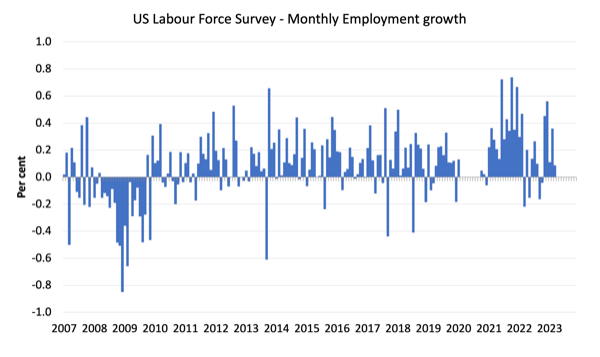
The following graph shows the monthly employment growth since January 2008 and excludes the extreme observations (outliers) between May 2020 and January 2020, which distort the current period relative to the pre-pandemic period.
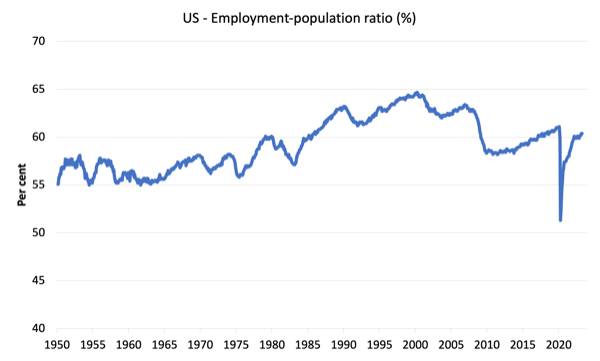
The Employment-Population ratio is a good measure of the strength of the labour market because the movements are relatively unambiguous because the denominator population is not particularly sensitive to the cycle (unlike the labour force).
The following graph shows the US Employment-Population from January 1950 to April 2023.
In April 2023, the ratio was unchanged at 60.4 per cent.
The peak level in May 2020 before the pandemic was 61.1 per cent.
Unemployment and underutilisation trends
The BLS note that:
Both the unemployment rate, at 3.4 percent, and the number of unemployed persons, at 5.7 million, changed little in April. The unemployment rate has ranged from 3.4 percent to 3.7 percent since March 2022 …
The number of long-term unemployed (those jobless for 27 weeks or more) changed little over the month at 1.2 million and accounted for 20.6 percent of the total unemployed …
The number of persons employed part time for economic reasons, at 3.9 million, was little changed in April. These individuals, who would have preferred full-time employment, were working part time because their hours had been reduced or they were unable to find full-time jobs …
So a fairly static picture continues.
The first graph shows the official unemployment rate since January 1994.
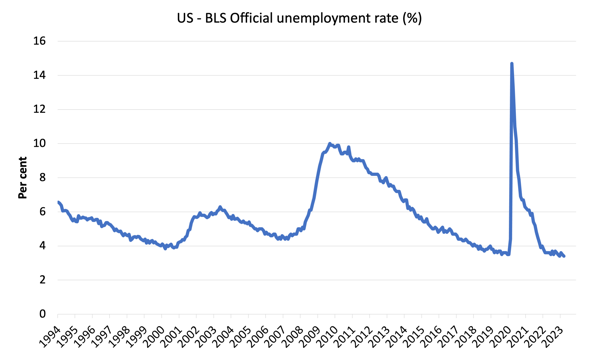
The official unemployment rate is a narrow measure of labour wastage, which means that a strict comparison with the 1960s, for example, in terms of how tight the labour market, has to take into account broader measures of labour underutilisation.
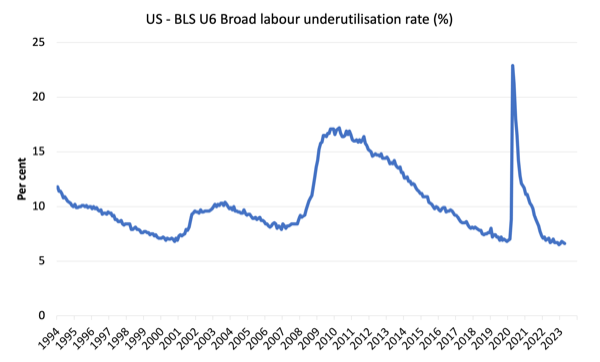
The next graph shows the BLS measure U6, which is defined as:
Total unemployed, plus all marginally attached workers plus total employed part time for economic reasons, as a percent of all civilian labor force plus all marginally attached workers.
It is thus the broadest quantitative measure of labour underutilisation that the BLS publish.
Pre-COVID, U6 was at 6.8 per cent (January 2019).
In April 2023 the U6 measure was 6.6 per cent, down by 0.1 point as a result of the fall in unemployment with other determining factors largely unchanged. It is still 0.1 point above the December 2022 level.
What about wages growth in the US?
The BLS reported that:
In April, average hourly earnings for all employees on private nonfarm payrolls rose by 16 cents, or 0.5 percent, to $33.36. Over the past 12 months, average hourly earnings have increased by 4.4 percent. In April, average hourly earnings of private-sector production and nonsupervisory employees rose by 11 cents, or 0.4 percent, to $28.62.
The latest – BLS Real Earnings Summary (published April 12, 2023) – tells us that:
Real average hourly earnings for all employees increased 0.2 percent from February to March, seasonally adjusted … This result stems from an increase of 0.3 percent in average hourly earnings combined with an increase of 0.1 percent in the Consumer Price Index for All Urban Consumers (CPI-U). …
Real average weekly earnings decreased 0.1 percent over the month due to the change in real average hourly earnings combined with a 0.3-percent decrease in the average workweek.
Real average hourly earnings decreased 0.7 percent, seasonally adjusted, from March 2022 to March 2023. The change in real average hourly earnings combined with a decrease of 0.9 percent in the average workweek resulted in a 1.6-percent decrease in real average weekly earnings over this period.
Overall, the inflationary pressures are moderating fast, and nominal wages growth is starting to deliver modest real wage increases. A good sign
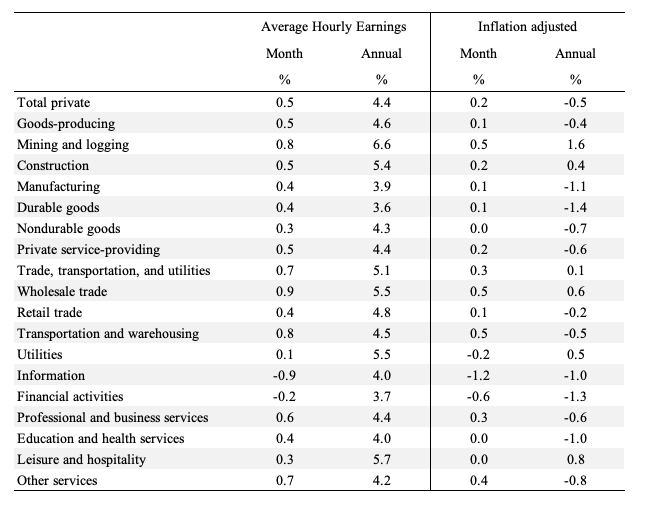
The following table shows the movements in nominal Average Hourly Earnings (AHE) by sector and the inflation-adjusted AHE by sector for April 2023 (note we are adjusting using the February CPI – the latest available).
There is considerable disparity across the sectors, with modest real wage increases starting to show in in most industries in the last month.
The following graph shows annual growth in real average hourly earnings from 2008 to April 2023.
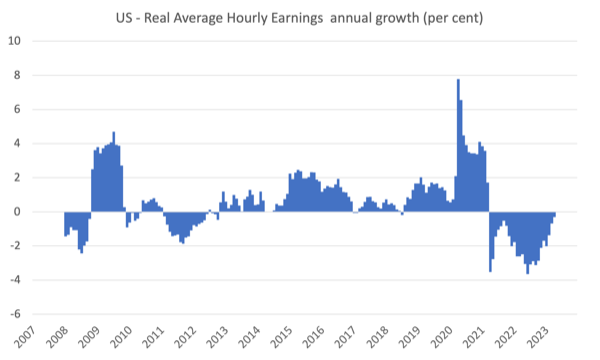
The real wage cuts have slowed and hopefully, workers will start enjoying sustained real wage gains.
The other indicator that tells us whether the labour market is turning in favour of workers is the quit rate.
The most recent BLS data – Job Openings and Labor Turnover Summary (released April 4, 2023) – shows that:
The number of job openings decreased to 9.6 million on the last business day of March … Over the month, the number of hires and total separations were little changed at 6.1 million and 5.9 million, respectively. Within separations, quits (3.9 million) changed little, while layoffs and discharges (1.8 million) increased …
In March, the number and rate of quits changed little at 3.9 million and 2.5 percent, respectively. The number of quits decreased in accommodation and food services (-178,000).
If the US labour market was in retreat, then the quit rate would be falling.
Conclusion
In April 2023, the latest US labour market data revealed no signs of a looming recession although there was a weakening of net employment growth.
March’s net employment change was still relatively strong compared to the pre-pandemic period.
Real wages finally showed some improvement in the face of a decelerating inflation rate.
Overall, the US labour market is steady and doesn’t appear to be contracting in the face of the Federal Reserve interest rate hikes.
That is enough for today!
(c) Copyright 2023 William Mitchell. All Rights Reserved.
