

What is the IRDA’s Latest Health Insurance Claim Settlement Ratio 2024? IRDA recently published its annual report on 28th Dec 2023. Let us try to demystify this report.

Many confuse between two terminologies used in the insurance industry. Claim Settlement Ratio Vs Claim Incurred Ratio. Hence, let us first try to understand the difference.
You can confuse yourself between incurred claim ratios to claim settlement ratios. The claim settlement ratio is the ratio of settled claims to the total claims filed in a given accounting period. Therefore, if the claim settlement ratio indicates 90%, then it means that out of 100 claims filed 90 claims are settled. The remaining 10% of claims are either rejected or pending with the insurance company.
However, in the case of incurred claim ratio, It is the ratio of the claim incurred by the insurance company to the actual premium collected for that period. You may also say it is a net claim settlement cost incurred to the net premium collected for a given accounting period. The formula for calculating is as below.
Incurred Claim Ratio = Net claims incurred/Net earned premium.
For example, let us say an insurance company’s incurred claim ratio is 90%. Then what it indicates is, that for every Rs.100 earned as a premium, Rs.90 is spent on the claims settled by the insurer. Therefore, Rs.10 is the profit to the company. If this incurred claim ratio is over and above 100%, then it indicates that they suffered a loss in their business.
THE CLAIM SETTLEMENT RATIO IS APPLICABLE FOR LIFE INSURANCE COMPANIES AND THE CLAIM INCURRED RATIO IS APPLICABLE FOR NON-LIFE INSURANCE COMPANIES.
This incurred claim ratio indicates how much you can believe in insurance companies when it comes to claims. Usually higher the incurred claim ratio then it is good for you. This is how the health insurance company’s performance is gauged. However, when it comes to the insurance company’s point of view, the higher the incurred claim ratio means the company is in loss. That is the reason usually insurance companies load your premium when they incur a higher loss in a particular age group segment (even though you do not have any claims in previous years).
When company A and company B have the same incurred claim ratio then it is hard for you to judge who settled claims quickly. So even though it may give a clear picture about an insurance company, but still hard to find who is efficient in claim settlement.
Interesting facts about health insurance from IRDA Annual Report 2023
# During 2022-23, insurers have settled about 86% of the total number of claims registered in their books and have repudiated about 8% of them and the remaining 6% were pending settlement as of March 31, 2023.
# Among various segments under the non-life insurance business, the health insurance business is the largest segment with a contribution of 38.02% (36.48% in 2021-22) of the total premium. The Health Insurance Segment reported growth of 21.32% (26.27% growth in 2021-22) with the premium amounting to Rs.97,633 crore from Rs.80,502 crore in 2021-22.
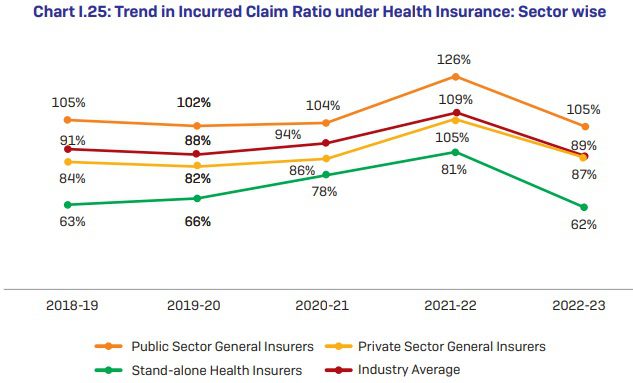
# The incurred claims ratio (net incurred claims to net earned premium) of the non-life insurance industry was 82.95% during 2022-23 against 89.08% of the previous year. The incurred claims ratio for public sector insurers was 99.02% for the year 2022-23 as against the previous year’s incurred claims ratio of 103.17%. Whereas for the private sector general insurers, standalone health insurers and specialized insurers have improved ICR with 75.13%, 61.44%, and 73.71% respectively for the year 2022-23 as compared to the previous year’s ratio of 77.95%, 79.06%, and 92.47% respectively.
# Segment-wise share of the premium collected by non-life insurers – Health 38%, Motor 32%, and Fire 9%.
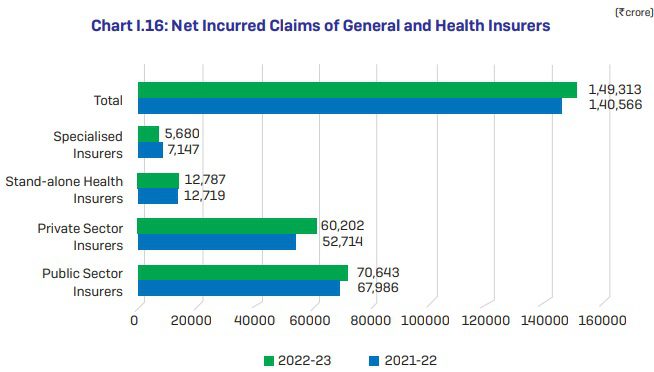
# Net Incurred Claims of General and Health Insurers data is as below.
# Sector-Wise Share in Premium of Health Insurance (2022-23) data – Standalone health insurers – 28%, public sector general insurers – 44% and private sector general insurers – 28%.
# Five States/UTs namely Maharashtra, Karnataka, Tamil Nadu, Gujarat, and Delhi contributed about 64% of total health insurance premiums in 2022-23, the rest of the States/ s have contributed the remaining 36%.
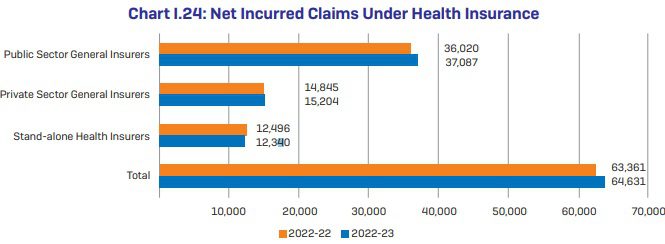
# Net Incurred Claims Under Health Insurance data
# Trend in Incurred Claim Ratio under Health Insurance: Sector-wise data
# During 2022-23, General and Health Insurers have settled 2.36 crore health insurance claims and paid Rs.70,930 crore towards the settlement of health insurance claims. The average amount paid per claim was Rs.30,087. In terms of claims settled, 75% of the claims were settled through TPAs and the balance 25% of the claims were settled through in-house mechanisms.
# In terms of the mode of settlement of claims, 56% of the total number of claims were settled through cashless mode and another 42% through reimbursement mode. Insurers have settled 2% of their claims amount through “both cashless and reimbursement mode.
# As of March 31, 2023, there are 18 active TPAs.
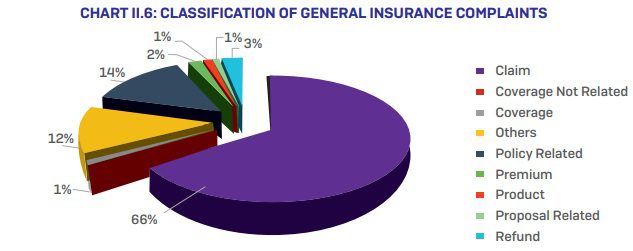
# Classification of General Insurance complaints data –
# Mode of Health Insurance Claim Settlement – The below data will give you clarity about cashless, reimbursement, TPA, and non-TPA claims settled by insurance companies.
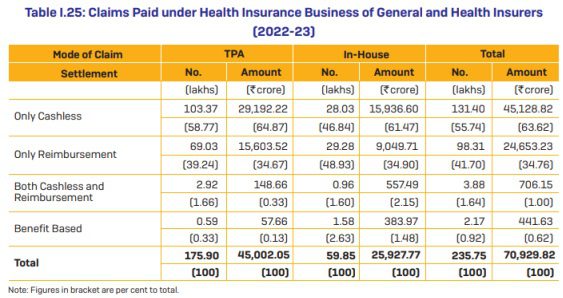
You noticed that cashless benefits are more for both TPA and in-house claim settlement.
Latest Health Insurance Claim Settlement Ratio 2024
Let us now look into the latest health insurance claim settlement ratio 2024.
Conclusion – Note that the headline of this post is “Latest Health Insurance Claim Settlement Ratio 2024”. I am forced to use this headline mainly because people look for the claim settlement ratio of health insurance without differentiating between claim settlement and incurred claim ratio. Again, the claim incurred is raw data. Just by looking at this data, one can’t judge the company’s performance of serving the customers.
In such a scenario, what to look for while buying health insurance? Understand the product features. Never sway with whatever is pushed by agents or social media experts. Try to understand the exclusions, coverages, and definitions properly. Just because you end up with a bad company does not mean they reject all your claims. Same way, just because you end up with a good company does not mean they accept all your claims. In my view, many rejections happen mainly because buyers are unaware of the conditions put by health insurance companies. We always believe that if we have health insurance, then all health-related hospitalizations must be covered. Sadly this is not the TRUTH.
The long-lasting solutions are – Being healthy and understanding what is covered and what is not. If a company rejects your claim without a valid reason, then a zeal to fight is most important.
Nowadays there are many online portals (brokers) or middlemen, who claim that they will help you in case of a claim. The counter thought you have to ask yourself is for how many years they will be in this business to help you in the long run. Learning on your own to fight is the best strategy than thinking of SOMEONE will help you when you need it.
