

Should we invest in Nifty 500 Index Fund? Let us compare Nifty 500 Vs Nifty 100 Vs Nifty 50 by looking at the last 21 years data and try to find an answer.
With the increasing popularity of Index Funds, mutual fund companies are progressively introducing a range of Index Funds to meet the diverse requirements of investors. However, despite the fact that Index Funds are regarded as superior and straightforward investment options, should one contemplate investing in all Index Funds?
We always think of owning a wider market than a limited market and we feel a wider market means better diversification. However, even though in plain it looks fantastic while choosing the products, you have to look for underlying stocks and their percentage. One such classic example is Nifty 500 Index.
What is the Nifty 500 Index?
The Nifty 500 index represents the top 500 companies selected based on full market capitalization from the eligible universe. Nifty 500 Index is computed using the free float market capitalization method, wherein the level of the index reflects the total free float market value of all the stocks in the index relative to a particular base period.
The Nifty 500 Index was created with a starting value on January 1, 1995, and is rebalanced every six months. As of April 30, 2024, the sector allocations are as follows: Financial Services at 29%, Oil, Gas, and Consumable Fuels at 9%, IT at 8.8%, Automobile and Auto Components at 7%, and FMCG at 7%.
Should we invest in Nifty 500 Index Fund?
Let’s examine the top stocks in the Nifty 500 index. A notable 58% of these stocks are part of the Nifty 50 index, while around 14% come from the Nifty Next 50 Index. This means that a substantial 72% of the Nifty 500 stocks are from Nifty 100. The remaining 28% of stocks are from the mid and small-cap sectors.
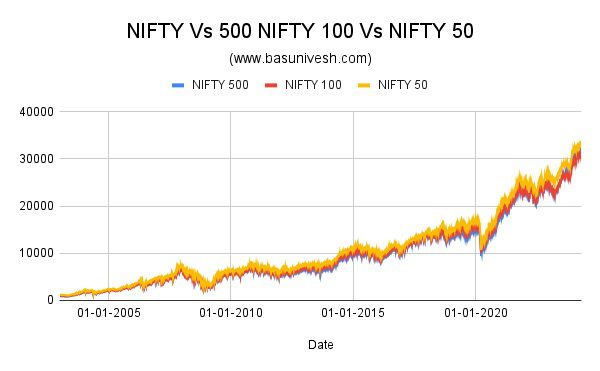
In such a situation is it wise to take a risk of investing in the Nifty 500 Index? Let us dig into the last 21 years’ data to find the answers. For our study purpose, let us take the data from 1st Jan 2003. Why from 2003? Because the Nifty 100 TRI data is available from 1st Jan 2003. Hence, I am considering the data of Nifty 500 TRI, Nifty 100 TRI and Nifty 50 TRI from 1st Jan 2003.
Do remember that as of now, Motilal Oswal is offering two funds -one as an ETF and another as an Index Fund.
The movement from 1st Jan 2003 looks like below.
However, this might not provide us with an accurate representation of volatility and superior performance. Therefore, let’s analyze the three Indices’ rolling returns for 1 year, 3 years, 5 years, and 10 years. Additionally, we should examine the consistent outperformance of the Nifty 500 TRI Index compared to both the Nifty 100 TRI and the Nifty 50 TRI.
NIFTY 500 TRI Vs NIFTY 100 TRI Vs NIFTY 50 TRI – 1 Yr Rolling Returns
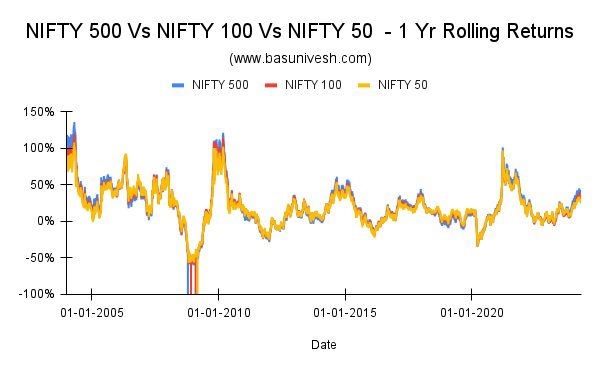
It is important to observe that there is minimal variation among the three, with the exception of a shorter timeframe. Nevertheless, when examining the consistent outperformance of the Nifty 500 TRI Index over the Nifty 100 TRI Index and Nifty 50 TRI Index, it is evident that the Nifty 500 TRI Index outperformed the Nifty 100 TRI Index for approximately 54% of the time in terms of one-year rolling returns. However, when comparing the Nifty 500 TRI Index to the Nifty 50 TRI Index, the outperformance is even greater, with a margin of 56%.
However, let us not judge the outperformance by looking at just 1 year rolling returns.
NIFTY 500 TRI Vs NIFTY 100 TRI Vs NIFTY 50 TRI – 3 Yrs Rolling Returns
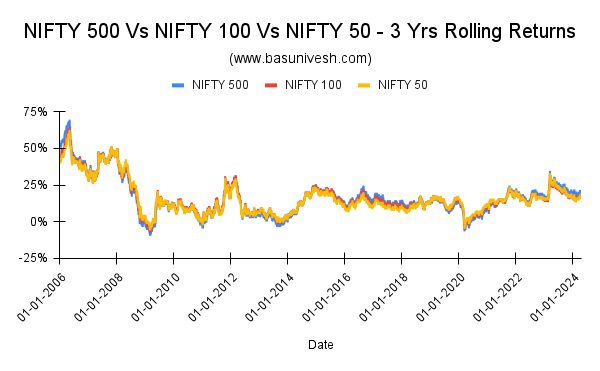
The recent outperformance of Nifty 500 TRI post-2022 can be easily visualized now. This is primarily due to the performance of mid and small cap stocks. However, the duration of this outperformance remains uncertain. Upon examining the consistency between Nifty 500 TRI Index and Nifty 100 TRI, it is evident that the former outperformed the latter 47% of the time. Similarly, the Nifty 500 TRI Index outperformed the Nifty 50 TRI 56% of the time.
However, let us not judge the outperformance by looking at just 3 years of rolling returns.
NIFTY 500 TRI Vs NIFTY 100 TRI Vs NIFTY 50 TRI – 5 Yrs Rolling Returns
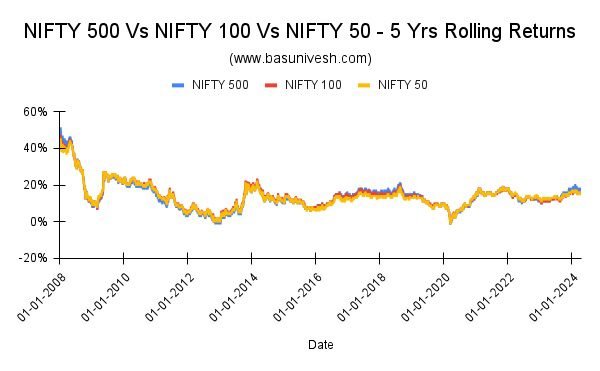
It is important to mention that the difference is not apparent when looking at the rolling returns over a 5-year period. However, when analyzing the consistency of the Nifty 500 TRI Index’s outperformance compared to the Nifty 100 TRI Index, it is quite astonishing. The Nifty 500 TRI Index outperformed the Nifty 100 TRI Index in only 37% of cases, and when compared to the Nifty 50 TRI Index, it was 38%. The level of consistent outperformance decreased significantly from the 1-year and 3-year periods to the 5-year period.
NIFTY 500 TRI Vs NIFTY 100 TRI Vs NIFTY 50 TRI – 10 Yrs Rolling Returns
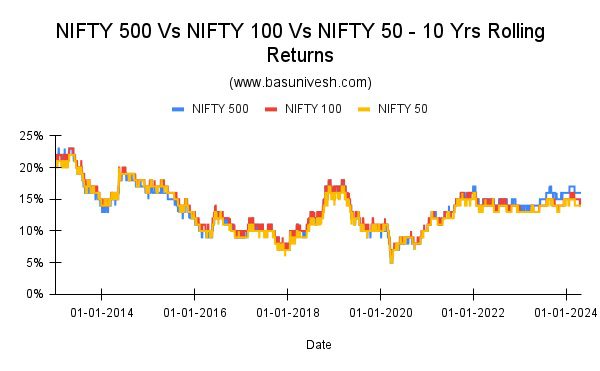
In analyzing the 10-year rolling returns, it is evident that the level of outperformance consistency has significantly decreased. The Nifty 500 TRI Index surpassed the Nifty 100 TRI by 32% on multiple occasions. Conversely, the Nifty 500 TRI Index outperformed the Nifty 50 TRI Index by 62% on numerous occasions. This outperformance is largely attributed to the Midcap and Smallcap sectors, particularly in recent years.
Conclusion – Do not be influenced by the recent performance of Midcap and Smallcap indices when selecting an Index that has exposure to these sectors. Upon reviewing historical data, it becomes evident that investing in the Nifty 500 Index may not be the most beneficial option. Opting for a simpler Nifty 50 or Nifty 100 Index would suffice for diversification purposes.
