

I think a lot of this recent sell-off is because some investors are already pricing in a recession in 2022 or early 2023.
But I’m not seeing a recession happening inside that time window as highly probable.
Here are a few reasons why…
1. The yield curve is steepening rather than inverting.
When the Fed over-tightens, the bond market starts to signal that the Fed needs to reverse course by driving short-term rates to rise above long-term rates…creating an “inverted yield curve.” Right now, long-term interest rates are rising faster than short-term rates…creating a “steep yield curve.” (see more below)
2. Most analysts still expect profits to rise this year.
In fact, according to Bespoke, 69% of companies that reported second quarter earnings beat their estimates, and 72% beat their revenue numbers.
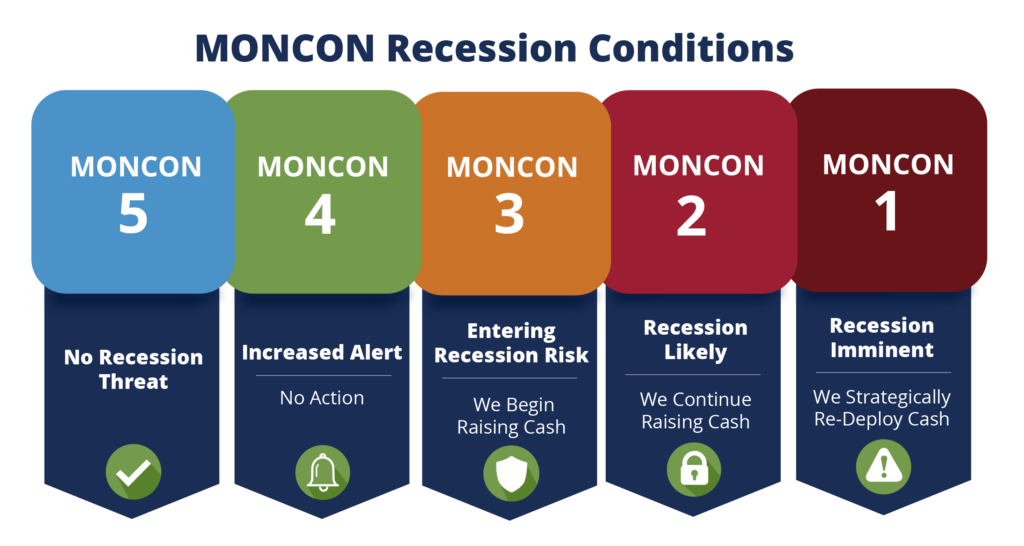
3. MONCON
Right now, we are at MONCON 5, meaning exactly ZERO input indices are indicating there is a probability of a recession within the next six months. A few notes:
- We’ve been tracking the MONCON Recession Model since 2016 and finally decided to make it a “public facing” discussion tool in October of 2018. You can find the initial primer/blog with the nuts and bolts here.
- It doesn’t work for an event-driven recession like COVID, so we give it a pass for not giving us a heads up in 2020.
- It’s kept us from inappropriately reacting to every single head fake since 2018.
- It’s designed to incrementally alert us to any rising probability of a recession, starting with lead times of six months at MONCON 4, four months at MONCON 3, three months at MONCON 2, and then one month at MONCON 1.
- This graphic is an overview and what we do to take action at each different MONCON level. Again, see that linked blog above for more details.
- Did I mention that MONCON is at a 5?
4. The percentage of all yield curve combinations is well below where they usually are at a recession.
Before I jump into “What the Hell does that mean?” let’s first answer, “Why do yield curve inversions point to a recession anyway?” For that answer, I consulted with the foremost authority on all financial questions: the internet. The following seemed like the most understandable answer (emphasis mine):
Banks make longer-duration loans to clients who pay the longer-term rates. These loans are the assets of the bank. Depositors lend money to the bank at the short-term interest rate. These are the bank’s liabilities. When the bank pays a higher rate on its liabilities than what it earns on its assets, it loses the incentive to forward more loans to businesses and stops lending. This causes a “credit crunch” or the falling availability of credit. Businesses struggle to roll over their current account credit, and they are forced to downsize and lay off workers, and we enter a recession. The moment the Fed engineers short-term interest rates to go below long-term interest rates, the banks can generate a profit again, credit expansion will resume, and the stock market and economy can recover.
If you think it’s important to pay attention to AN inverted yield curve (for example, the 2-year / 10-year yield curve) as a tool to predict a recession, then why not look at ALL the different yield curve combinations and try to determine what percentage of of the total combinations have to be inverted to call a recession accurately?
Hummmm…okay, let’s look – there are basically 28 combinations of the following treasury rates: 10yr/7yr/5yr/3yr/2yr/1yr/6mos/3mos. I say “basically” because the 30yr/20y/1mos rates are not included due to inconstant data…but that’s okay because I’m just making an observation…and a point.
- Of the 28 different combinations of rates on May 6th, exactly ONE is inverted (the 7/10 yr). That’s 4% of the 28 different combinations.
- On April 1st, there were 7 of the 28 combinations inverted.
- The data show that 22 of the different combinations have to be inverted (~61%) to accurately predict a recession within the next 8-16 months.
Read the above again – currently, only ONE is inverted, and there generally have to be 22 to get a recession.
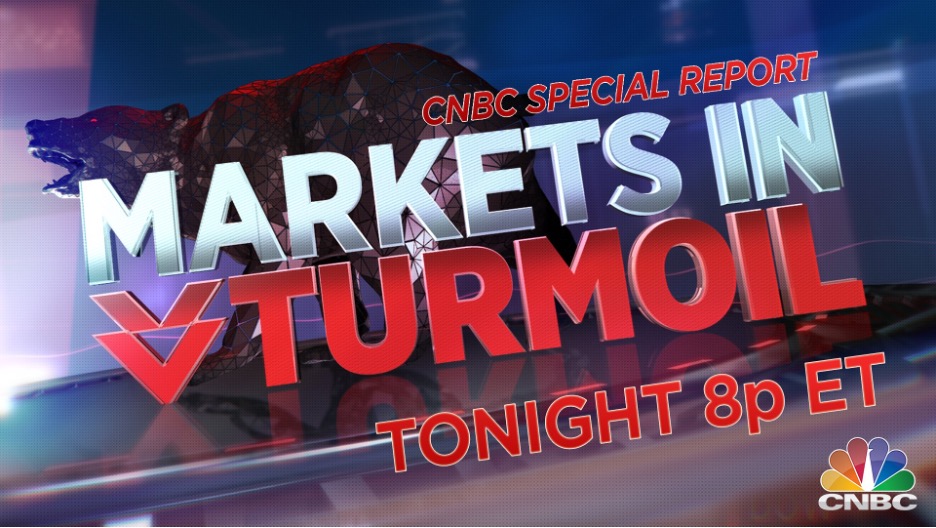
5. CNBC.
Yup, I’m using CNBC to tell you that I don’t think there is a recession starting anytime soon. “Dave Armstrong, shut the FRONT DOOR!” you say? Yup. Here’s why – they ran the famous “CNBC SPECIAL REPORT MARKETS IN TURMOIL,” complete with the red double down arrow graphic.
Why is that important? Well, thanks to some great data collection and analysis by Charlie Bilello (@charliebilello on Twitter – go follow him), we know they have had 106 of these Special Reports since May 2010. ONE HUNDRED AND SIX! (Charlie, come work at Monument with all of us, we’d basically never work because all we’d do is have fun writing, lol!)
Want to know how many times the market has been down one year later?
0…EXACTLY ZERO
Want to know the average return on the S&P 500 at the one-year anniversary of the “Special Report”?
+40%…POSITIVE FORTY PERCENT
So in actuality, it really may be a “SPECIAL REPORT.”
There’s Always SOMETHING Looming on the Horizon…
I know these markets are tough, and no one likes seeing their portfolios go down. All I’m saying is that if you have a war chest of cash, you can feel crappy about this but don’t feel bad. I think when these pessimistic sellers realize they made a bad call to sell, they will get back in, and that should drive equities back up.
In fact, I’ll wager a guess that a lot of the worst is over – as of Friday, 47% of the S&P 500 stocks are down 50%…FIFTY PERCENT! The people REALLY feeling this pain are the ones who thought it was genius to diversify across 5-10 stocks and some Bitcoin for inflation protection.
I’m not living in a fantasy land saying everything will get better from here. In fact it can and may get a lot worse – Fed risk, inflation, we have not hit a bear market 20% correction, the S&P 500 in a technical downtrend, a slowing economy, fiscal drag, Russia & Ukraine (I may have to rebrand MONCON), oil prices, strengthening dollar, poor economic sentiment, supply chain issues, rising mortgage rates…the list goes on.
But remember – there is always SOMETHING looming on the horizon, and stocks often climb a wall of worry. From Goldman Sachs:
I’ll end by reminding everyone to listen to one of our recent episodes of Off The Wall Podcast where Jessica and I interviewed Dr. Daniel Crosby, a best-selling author and a Behavioral Finance MASTER.
He tells you why your brain is the biggest enemy you face as an investor.
Keep looking forward.

