
When it comes to equity investment, many of us are living in DREAM than understanding REALITY. Recently I came across a tweet where it was assumed the past Nifty 50 performance of 13% to 14% returns. Based on that, the rosy picture of compounding was created and showcased how easy it is to create wealth by just assuming past returns of Nifty. It is nothing but a half-baked truth.
Basically, the tweet was as below.
If you are investing 30k per month, the first 1 Cr will take about 12 years (assuming 13-14% CAGR in line with nifty 50 historical returns). The 2nd crore will take only 4 years The third crore: only 2 yrs
And…. That’s compounding! Money makes money.
Amazingly it is TRUE on paper. However, the journey of these 12 years (where you accumulate the first one crore) and later on the remaining 6 years journey (in total 18 years journey) is not so smooth as these FINANCIAL INDUSTRY EXPERTS teach us.
In my earlier posts also, I have showcased that to reap the benefits of compounding, what are the ingredients we must have – “Power Of Compound Interest – NOT the 8th Wonder of the world!“.
In this post also, let us run the test based on NIfty 50 TRI data of the past 19 years (from 2003) and let us see how this DREAM Vs REALITY actually looks like.
Equity Investment – Dream Vs Reality
I have taken the Nifty 50 TRI data from Jan 2003 to March 2022 (The Nifty 50 TRI data is available from 2003). This will give us around 4,617 daily values of the Nifty 50 TRI Index. I have selected the 10th as the SIP date for every month (just randomly).
Same way, I have calculated the SIP like how it was showcased in that Tweet of investing monthly Rs.30,000 for the next 19 years and assuming the returns of Nifty 50 TRI of 13.4%.
When we graph the DREAM of assuming 13.4% returns on investment versus the journey of the Nifty 50 TRI Index for 19 years, it looks like the below.
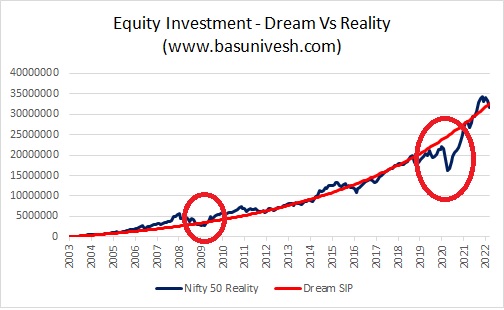
Notice the graph cautiously especially around the 2008-2009 downfall and during the recent crash of 2020. Actually, the drawdown during 2008-2009 was almost around 50% in value. It is not visible in the graph as the amount was less compared to what it was in 2020.
The dream SIP journey as usual looks smooth. However, the real journey of SIP in Nifty 50 TRI was filled with a lot of ups and downs. As I told you, during the 2008-2009 market crash, your invested value was down by almost 50%.
This can be calculated from the drawdown of the portfolio. The drawdown is nothing but the % of fall from its earlier peak. The drawdown chart of the investment for the past 19 years in Nifty 50 TRI looks like below.
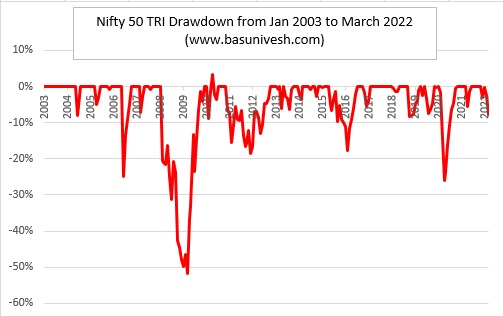
You noticed that during the period of 2008-2009, the maximum drawdown in the portfolio was almost around 51%. In the same way, you can also experience it during the 2020 crash too but not in a big way.
Let us also try to understand this volatility through the rolling return of Nifty 50 TRI over the past 19 years. This will actually give you the actual sense of volatility.
# Nifty 50 TRI 3 Yrs Rolling Returns

The maximum return for such 3 years’ rolling returns was 61% and at the same time, the minimum return was -4.7%. It means during this 19 years period, if someone is investing for 3 years period, then one can expect such returns. It is based on the available 3,879 3 years of period data.
# Nifty 50 TRI 5 Yrs Rolling Returns
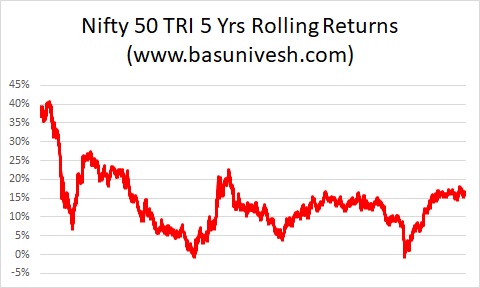
For 5 Yrs rolling returns, the maximum return was 41% and the minimum was -1%. Hence, if suppose someone investing in Nifty 50 and holding for 5 years, then these two extreme results happened in the past. This is based on the available 3,376 values of 5 years’ rolling returns.
# Nifty 50 TRI 10 Yrs Rolling Returns
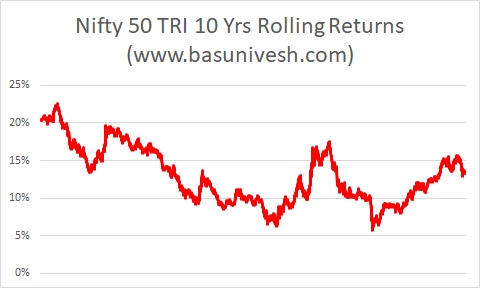
For 10 years of rolling returns, the maximum return was 23% and the minimum was 6%.
# Nifty 50 TRI 15 Yrs Rolling Returns

Let us now consider a longer time horizon of 15 years, you noticed that the maximum returns one might generate was 19% and the minimum was 10%.
It is evident from all the above points that Nifty generated around 13% to 14% returns since its inception. However, it is based on point-to-point calculation. But the journey was not so smooth. It was filled with a lot of ups and downs, which many of these guys ignore and showcase only the rosy picture of equity investment.
Targetting or expecting 10% to 13% or 14% is fine. However, the point here to note is how was the journey and how volatile was this journey. Hence, equity investing is fine and the theory of compounding is also fine. However, if you fail to understand the path and what are the eligibility qualities of an investor to sustain such volatility, then you may face failure even after investing for the long term. Hence, be realistic with your expectation and also give importance to a path like how you are giving importance to the goal. Never be in the trap of such a rosy picture explained to you by the financial industry.
