
Yves here. Look out below! Wolf Richter’s latest report on the state of residential residential real estate is not pretty, not that that is surprising given rising interest rates. But new houses are doing much less badly in the South (well, price wise, not inventory-wise). Could that be that be due to prices not appreciating as much as ones in/near metro areas with a lot of “work from home” professionals hoovering up more shelter?
The median price of new single-family houses that were sold in June plunged by 9.5% from May, to $402,400, the lowest since June last year, according to the Census Bureau today. The plunge in June after the drop in May reduced the year-over-year gain to 7.4%, from the 20%+ in the spring.
Median prices are noisy with month-to-month moves, and some caution needs to be used here. But this was nevertheless an extraordinary plunge of a magnitude that occurred only three times before in the data going back to 1965: During the second dip of the Double-Dip Recession (Sep 1981), during the Housing Bust (Oct 2010), and in Sep 2014.
Clearly, potential buyers are now having second thoughts, given the spike in mortgage rates, and homebuilders are responding to this decline in demand and the surge in cancellations by piling on incentives and cutting prices:
The largest homebuilder, D.R. Horton, said in its earnings reportlast week: “The increase in our cancellation rate in the current quarter primarily reflects the moderation in demand we experienced in June 2022 as mortgage interest rates increased substantially and inflationary pressures remained elevated.
Sales Drop to Level of Lockdown April 2020.
Sales of new single-family houses dropped by 8.1% from May, to as seasonally adjusted annual rate of 590,000 houses, down by 17.4% from a year ago, and just barely above lockdown April 2020, and beyond that the lowest since late 2018, when mortgage rates had hit the magic number of 5%:
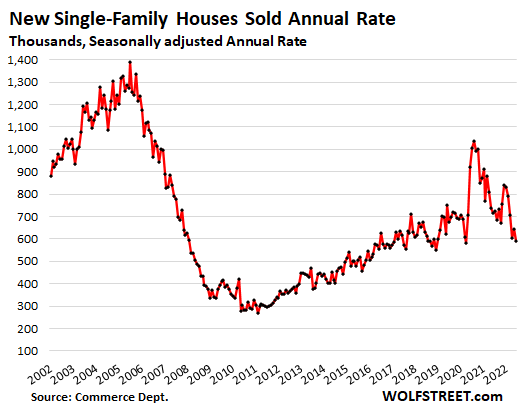
Similar drops in sales occurred with existing homes where sales plunged 14% in June from a year ago. So that’s previously owned houses, condos, and townhouses. Particularly noteworthy with existing sales was California’s 21% plunge in closed sales and the 40% collapse in pending sales.
New house sales plunged in every regioncompared to June last year, but plunged the most in the Northeast:
- Northeast: -37.9%
- West: -32.9%
- Midwest: -22.1%
- South: -8.7%.
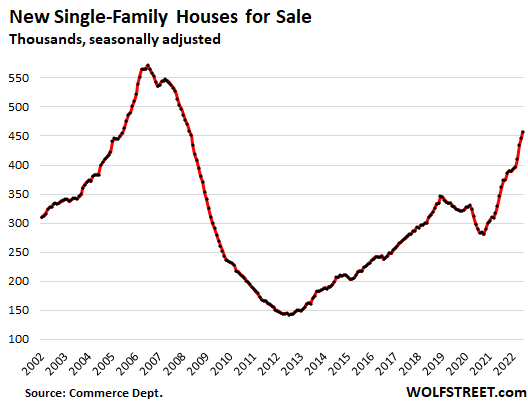
No Folks, There Is No “Housing Shortage,” but Prices Are Still Way Too High.
Houses for sale in all stages of construction continued to pile up in an amazing series that began in August 2020 and in June reached 457,000 houses, seasonally adjusted (and 463,000 houses not seasonally adjusted), the highest since May 2008, and up by 113,000 houses, or by 32%, from June last year:
By region, unsold inventory rose in all regions but spiked the most in the Midwest and the South, in terms of the percent increase year-over-year:
- Midwest: +62%
- South: +33%
- West: +28%
- Northeast: +4%.
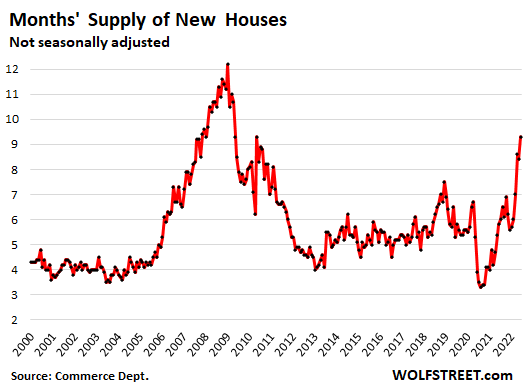
Supply of unsold new houses spikedto 9.3 months of sales, same as in May 2010, and both had been the highest since April 2009, during the depth of the housing bust. This is a huge amount of supply:
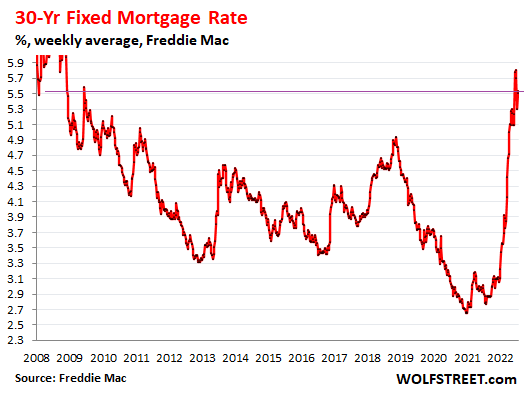
Potential Homebuyers Gaze at Holy-Moly Mortgage Rates.
They’re called “holy-moly” because that’s invariably the sound potential homebuyers make when they see the payment for the house they wish to buy at current mortgage rates and still sky-high prices.
The average 30-year fixed mortgage rate, according to Freddie Mac’s measure, was 5.54% in the last reporting week and has been above 5% since mid-April. With each increase in mortgage rates, entire layers of potential buyers abandon the market as long as prices remain too high:
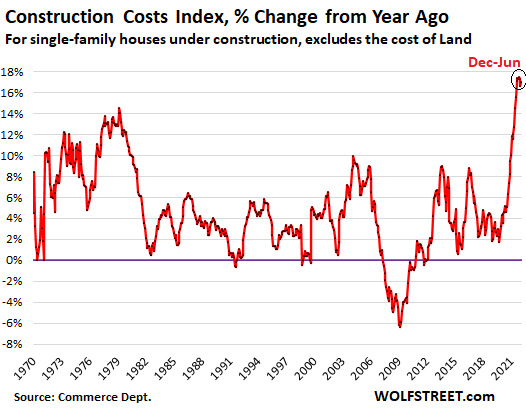
Homebuilders Struggle With the Worst Construction-Cost Inflation Ever.
Homebuilders have been facing shortages of materials, supplies, and labor that delayed projects, and price spikes that triggered astounding cost-overruns, and deliveries of completed houses got tangled up.
Construction costs of single-family houses – excluding the cost of land and other non-construction costs – spiked by 17% year-over-year, and has been in that range since December last year, the worst spike in construction costs ever in the data going back to 1964, according to separate data from the Census Bureau today. June was the 14th month in a row of double-digit spikes in construction costs:
Homebuilder Stocks…
Despite a powerful summer rally that now seems to have run into trouble, the stocks of homebuilders are down between 24% and 36% year-to-date and have easily out-dropped the S&P 500 Index (-18% year-to-date):
- Horton: -31%
- Lennar: -31%
- PulteGroup: -24%
- NVR: -26%
- Taylor Morrison: -23%
- Meritage: -30%
- KB Home: -30%
- Century: -36%
- LGI Homes: -33%

