
Today (April 18, 2024), the Australian Bureau of Statistics released the latest – Labour Force, Australia – for March 2024, which shows that the labour market is weakening with employment falling and unemployment rising now that more normal patterns in behaviour after the holiday period disruption have returned. The good news is that full-time employment continued to rise but was more than offset by the loss of part-time work. The stronger full-time outcome meant thta underemployment fell marginally. The rise in unemployment would have been worse had not the participation rate fell. The drop in both employment nd participation is a signal of weakening. There is still 10.3 per cent of the available and willing working age population who are being wasted in one way or another – either unemployed or underemployed and that proportion is increasing. Australia is not near full employment despite the claims by the mainstream commentators and it is hard to characterise this as a ‘tight’ labour market.
The summary ABS Labour Force (seasonally adjusted) estimates for March 2024 are:
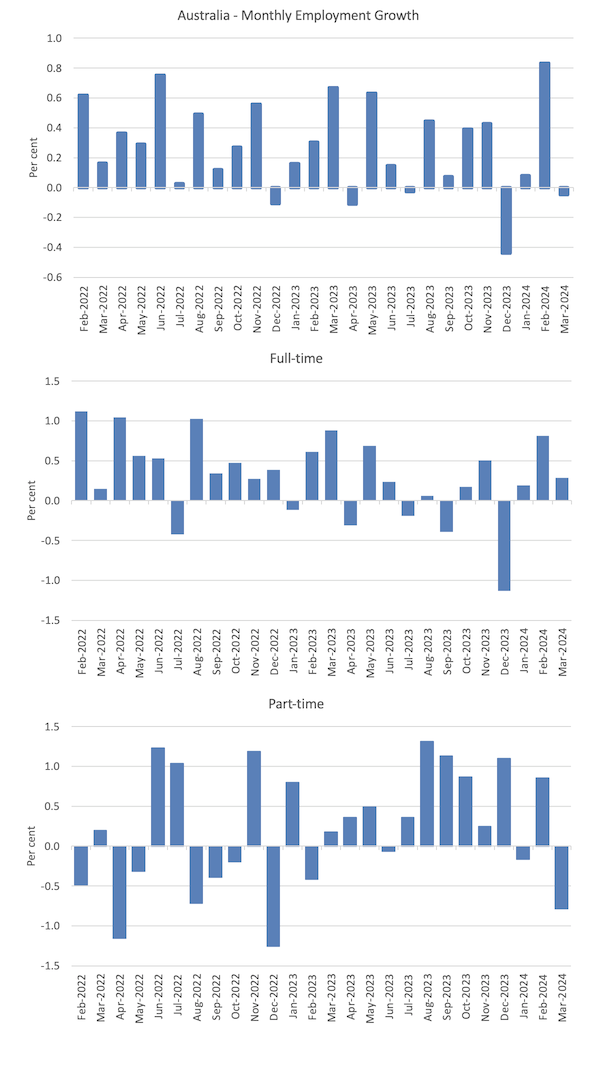
- Employment fell 6,600 (0.0 per cent) – full-time employment increased by 27.9 thousand and part-time employment decreased by 34.5 thousand. Part-time share of total was 30.6 per cent.
- Unemployment rose 20,600 to 569,900 persons.
- The official unemployment rate increased 0.1 point to 3.7 per cent (-0.4 points).
- The participation rate fell 0.1 point at 66.6 per cent.
- The employment-population ratio fell 0.2 points to 64 per cent.
- Aggregate monthly hours rose by 17.4 million (+0.9 per cent).
- Underemployment rate fell 0.1 point to 6.5 per cent (-13.7 thousand). Overall there are 958.3 thousand underemployed workers. The total labour underutilisation rate (unemployment plus underemployment) was steady at 10.3 per cent. There were a total of 1528.1 thousand workers either unemployed or underemployed.
In the ABS Media Release – Unemployment rate rises to 3.8% in March – the ABS noted that:
The seasonally adjusted unemployment rate rose by 0.1 percentage point to 3.8 per cent in March …
With employment falling by around 7,000 people and the number of unemployed rising by 21,000 people, the unemployment rate rose to 3.8 per cent …
The small drop in employment in March followed a larger-than-usual flow of people into employment in February, following smaller-than-usual flows in December and January. However, in March, the flows into employment had returned to a more usual pattern.
As a result of the fall in employment and the pace of growth in the population, the seasonally adjusted employment-to-population ratio fell 0.2 percentage points to 64.0 per cent and the participation rate fell 0.1 percentage point to 66.6 per cent.
General conclusion:
1. The return to the more normal patterns after the holiday period disruption in behaviour shows that the labour market is weakening with employment falling and unemployment rising.
2. The good news is that full-time employment continued to rise but was more than offset by the loss of part-time work.
3. The stronger full-time outcome meant thta underemployment fell marginally.
Employment fell 6,600 (0.0 per cent) in March 2024
1. Full-time employment increased by 27.9 thousand and part-time employment decreased by 34.5 thousand. Part-time share of total was 30.6 per cent.
2. The employment-population ratio fell 0.2 points to 64 per cent – a reliable indicator of a weakening situation.
The following graph show the month by month growth in total, full-time, and part-time employment for the 24 months to March 2024 using seasonally adjusted data.
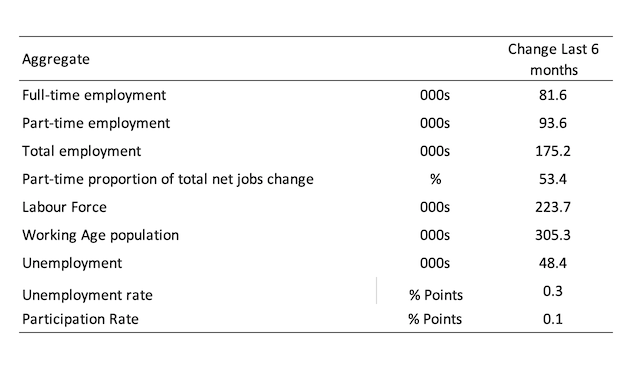
The following table provides an accounting summary of the labour market performance over the last six months to provide a longer perspective that cuts through the monthly variability and provides a better assessment of the trends.
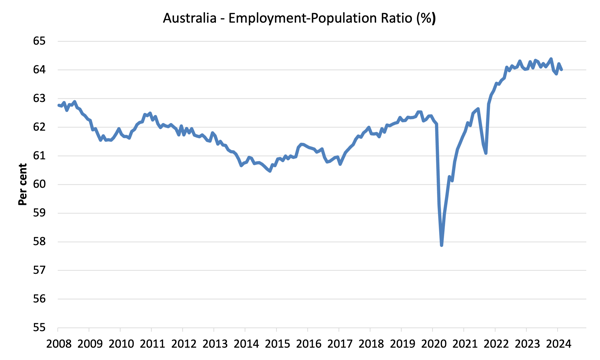
Given the variation in the labour force estimates, it is sometimes useful to examine the Employment-to-Population ratio (%) because the underlying population estimates (denominator) are less cyclical and subject to variation than the labour force estimates. This is an alternative measure of the robustness of activity to the unemployment rate, which is sensitive to those labour force swings.
The following graph shows the Employment-to-Population ratio, since March 2008 (that is, since the GFC).
The employment-to-population ratio is still demonstrating stability with minor fluctuations around the current level.
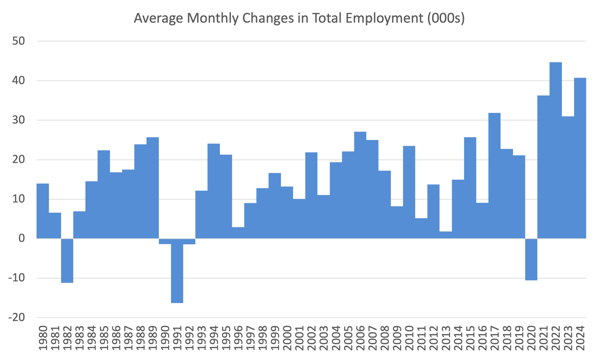
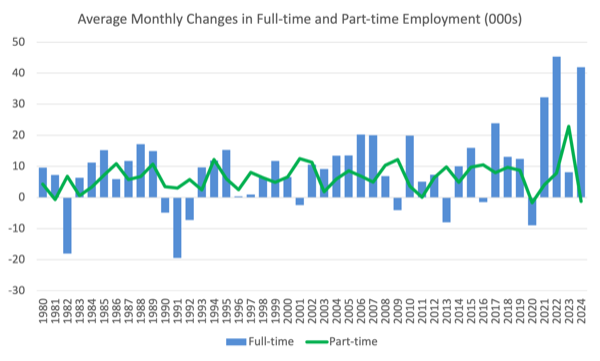
For perspective, the following graph shows the average monthly employment change for the calendar years from 1980 to 2024.
1. The average employment change over 2020 was -10.6 thousand which rose to 36.3 thousand in 2021 as the lockdowns eased.
2. For 2022, the average monthly change was 44.7 thousand, and for 2023, the average change was 31 thousand.
3. So far in 2024, the average monthly change is 40.8 thousand.
The following graph shows the average monthly changes in Full-time and Part-time employment in thousands since 1980.
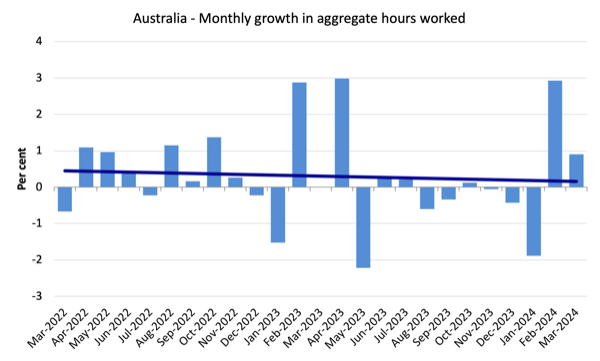
Aggregate monthly hours rose by 17.4 million (+0.9 per cent) in March 2024
The srise in hours workerked rose despite the fall in overall employment because there was a shift in favour of full-time work, which grew but could not offset the decline in part-time work.
The following graph shows the monthly growth (in per cent) over the last 48 months (with the pandemic restriction period omitted).
The dark linear line is a simple regression trend of the monthly change.
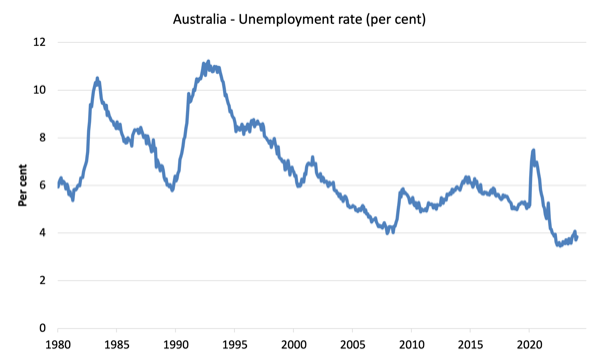
Unemployment rose 20,600 to 569,900 persons in March 2024
The overall loss of employment was offset somewhat in terms of its impact on umemployment by the decline in the participation rate.
ore than outstripped the rising participation rate and as a result official unemployment fell sharply.
The drop in both employment nd participation is a signal of weakening.
The following graph shows the national unemployment rate from March 1980 to March 2024. The longer time-series helps frame some perspective to what is happening at present.
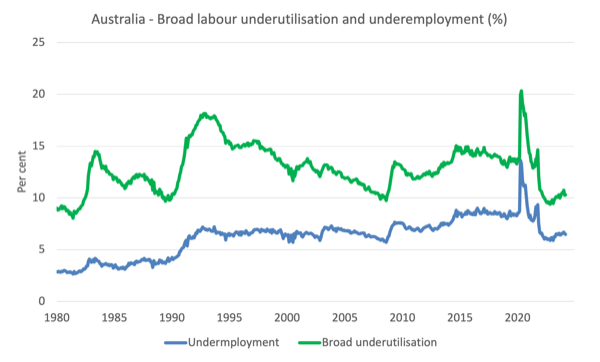
Broad labour underutilisation was steady at 10.3 in March 2024
1. Underemployment rate fell 0.1 point to 6.5 per cent (-13.7 thousand).
2. Overall there are 958.3 thousand underemployed workers.
3. The total labour underutilisation rate (unemployment plus underemployment) was steady at 10.3 per cent.
4. There were a total of 1528.1 thousand workers either unemployed or underemployed.
The fact that there is 10.3 per cent of workers who are both available and willing to work that are without work in one way or another (unemployed or underemployed) makes a mockery of claims by economic commentators and policy officials that Australia is near full employment or that this is a tight labour market.
The following graph plots the seasonally-adjusted underemployment rate in Australia from April 1980 to the March 2024 (blue line) and the broad underutilisation rate over the same period (green line).
The difference between the two lines is the unemployment rate.
Teenage labour market improves in March 2024
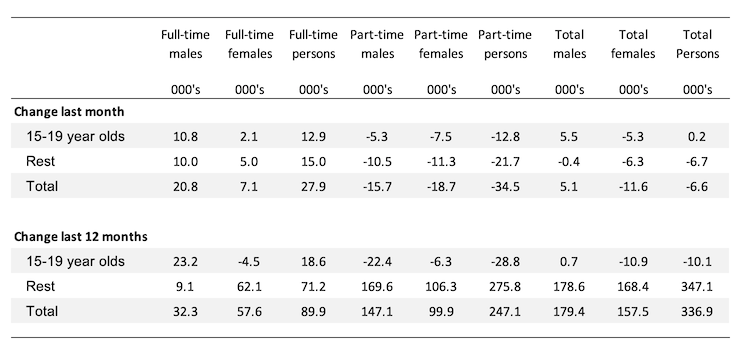
Overall teenage employment rose by 0.2 thousand but full-time employment rose by 12.9 thousand while part-time employment fell 12.8 thousand.
The following Table shows the distribution of net employment creation in the last month and the last 12 months by full-time/part-time status and age/gender category (15-19 year olds and the rest).
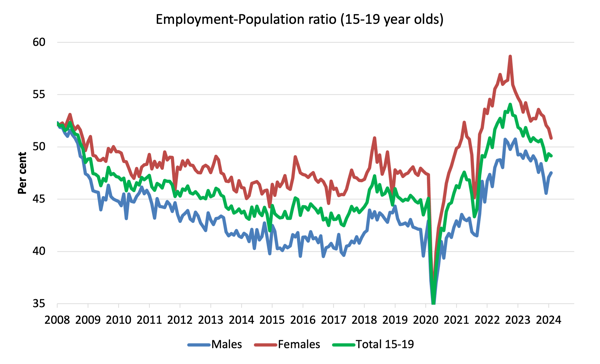
To put the teenage employment situation in a scale context (relative to their size in the population) the following graph shows the Employment-Population ratios for males, females and total 15-19 year olds since July 2008.
You can interpret this graph as depicting the change in employment relative to the underlying population of each cohort.
In terms of the recent dynamics:
1. The male ratio rose 0.4 points over the month.
2. The female ratio fell 0.9 points over the month.
3. The overall teenage employment-population ratio fell 0.2 points over the month.
There has been a concerted improvement in the male situation in recent months at the expense of females.
However, there has been an on-going deterioration in the job opportunities for the growing teenage population since November 2022.
The RBA’s desire to deliberately create unemployment in Australia has probably damaged this cohort more than any.
And this cohort is the future workers who we will depend on for higher productivity as the population ages.
It is smart policy (not!) to undermine their work opportunities at the age that they will be acquiring skills and experience.
Conclusion
My standard monthly warning: we always have to be careful interpreting month to month movements given the way the Labour Force Survey is constructed and implemented.
My overall assessment is:
1. The return to the more normal patterns after the holiday period disruption in behaviour shows that the labour market is weakening with employment falling and unemployment rising.
2. The good news is that full-time employment continued to rise but was more than offset by the loss of part-time work.
3. The stronger full-time outcome meant thta underemployment fell marginally.
4. The rise in unemployment would have been worse had not the participation rate fell.
5. The drop in both employment nd participation is a signal of weakening.
6. There is still 10.3 per cent of the available and willing working age population who are being wasted in one way or another – either unemployed or underemployed and that proportion is increasing.
7. Australia is not near full employment despite the claims by the mainstream commentators and it is hard to characterise this as a ‘tight’ labour market.
That is enough for today!
(c) Copyright 2024 William Mitchell. All Rights Reserved.
