
Jelle Barkema, Maren Froemel and Sophie Piton

Record-high firm exits make headlines, but who are the firms going out of business? This post documents three facts about the rising number of corporations dissolving using granular data from Companies House and the Insolvency Service. We show that the increase in dissolutions that have already materialised reflected a catch-up following Covid and was concentrated among firms started during Covid. While these firms were small and had a limited macroeconomic impact, firms currently in the process of dissolving are larger. Their exit might therefore be more material from a macroeconomic perspective. We also discuss how the recent economic environment could contribute to further rises in dissolutions and particularly insolvencies in the future that could have more material macroeconomic impact.
Fact #1: A rising number of firms removed from Companies House register since end-2021
Chart 1 draws the latest trends in firm registrations and dissolutions on Companies House register. It shows cumulative corporation births and deaths relative to a continuation of the 2019 trend. All analysis in this blog is up to 2023 Q3.
There has been a surprising surge in business creation since the Covid-19 pandemic and, as the chart shows, the number of new firm registrations with Companies House (purple line) is still rising above its 2019 trend (the first year when the ONS started recording data from companies house). The recent rise is driven by the retail, information and communications sectors. The persistent strength in firm entry has also been documented and discussed for the US, and could be related to structural changes in the online retail sector accelerated by the pandemic or, more recently, advances in AI technology (see Decker and Haltiwanger (2023)).
Chart 1: Companies house: cumulative count of weekly registrations and dissolutions for old/young firms relative to a continuation of 2019 average rate

Sources: Authors’ calculations using ONS and Companies House, and Bureau van Dijk FAME.
The chart also shows the trend in firm dissolutions (orange line) that has also been rising continuously from end-2021, after a slow-down related to the main ‘easement period’ where Companies House stopped registering most firm dissolutions. As a result, dissolutions were below their 2019 trends and the increase initially reflected a ‘catching-up’ to their 2019 trend. However, the rise continued through 2023 such that we are now seeing ‘excess’ exit – dissolutions above their 2019 trend.
We also investigate a specific subset of dissolutions: insolvencies. Despite their small share in the total number of dissolutions (less than 5%), insolvencies are of particular interest as they usually concern larger and indebted firms. The insolvency process includes selling off the company’s assets to help repay their creditors, frequently resulting in those creditors taking a loss. If insolvencies occur in large numbers or for heavily indebted firms, these losses could impact financial stability.
As laid out in a previous post (Barkema (2023)), UK business insolvencies since the pandemic have reached record highs and remain elevated. Similar to dissolutions, this is partially catching up: there was a moratorium on insolvencies between 2020 and 2022. However, insolvencies have now eclipsed their pre-pandemic trend and monthly totals are approaching levels last seen during the global financial crisis.
Fact #2: Firms removed so far are mostly small Covid-born firms with limited macroeconomic impact
We look at the age of firms exiting and find that the rise in firm exit is driven by Covid-born firms (gold line on Chart 1) and not by firms born before Covid (grey line on Chart 1), whose cumulative exits remain below pre-Covid trends.
Bahaj, Piton and Savagar (2023) have showed that the rise in firm entry during the pandemic was driven by individual entrepreneurs creating their first company, particularly in online retail, and that these were more likely to exit and less likely to post jobs in their first two years than firms born pre-Covid. Overall, this implied that, despite surging firm creation during the pandemic, the overall employment effect was limited.
We look at trends in firm entry and exit in the ONS business census to confirm this intuition. The ONS data set only includes firms with employees (PAYE) or with a large enough turnover (VAT). It is one of the main data sources for the National Accounts. Chart 2 shows that there was no rise in entry or exit over the corresponding period. This suggests that most Covid-born firms were too small to show up in the ONS census and, in line with previous research, they indeed have only had a marginal impact on aggregate employment and productivity. In contrast to Companies House data, entry in the ONS Census has also been declining in the recent period, while exit increased slightly, resulting in a negative net entry rate since end-2022.
Chart 2: Employment-weighted firm birth/death rate in ONS Business Census

Source: Authors’ calculations using ONS business demography, quarterly experimental statistics.
Of course, other factors could also be at play to explain the recent rise in exits that should be investigated in future work. For example, we find that dissolutions in sectors with a higher share of energy costs have increased relatively more in the recent period, consistent with Ari and Mulas-Granados (2023) who find higher energy prices are correlated with more firm exits.
Fact #3: Rising number of firms at risk of being removed this year, with more uncertain macroeconomic impact
Companies House also includes information on firms in the process of dissolving. This has been rising above 2019 levels even more sharply – suggesting there are more excess exits likely to be realised soon. Chart 3 shows these dissolution notices to Companies House (pink line) that the ONS tracks. Companies House suggests there is a larger number of firms in the process of dissolving than usual and that remain in that status for longer than usual, and that this is related to outstanding Bounce Back Loans (BBL) that need to be repaid before a business can fully dissolve.
We investigate the characteristics of the firms in the process of dissolving in Chart 4. There are 12% of firms on register in December 2023 that have already started a dissolution procedure (~600k firms), a further 4% (~170k firms) are at risk of being dissolved. These firms have stopped trading and our evidence suggests that the majority of these are not Covid firms anymore (older than three years old). As firms had to be established before 1 March 2020 to be eligible, this is also consistent with outstanding BBLs as a factor for the delay in the dissolution. While these firms remain small, their size is increasing – they are now larger than Covid-born firms. This suggests the risk from dissolutions to come is more material than dissolutions seen so far. Note that these firms are mostly low-productive (with a lower turnover per employee than the average active firm.
Chart 3: Companies House: cumulative count of weekly registrations, dissolutions and dissolution notices (firms that have started a dissolution process) relative to a continuation of 2019 average rate

Sources: Authors’ calculations using ONS and Companies House, Bureau van Dijk FAME.
Chart 4: Companies House: number of firms in the process of dissolving by firm characteristics, as of December 2023

Sources: Authors’ calculations using Companies House and Bureau van Dijk FAME.
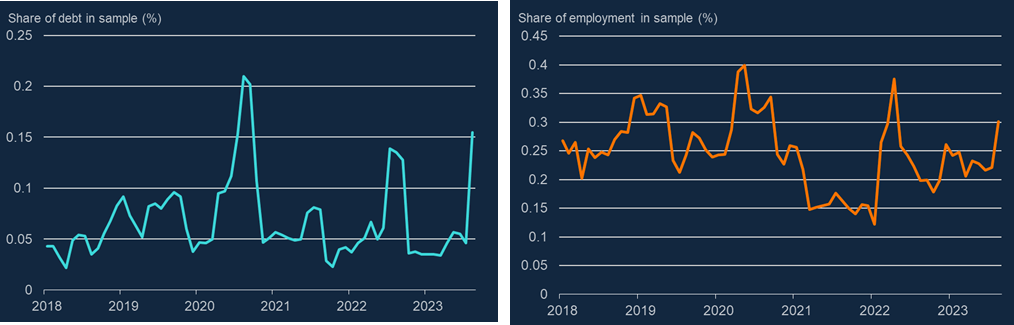
The vast majority of insolvencies result in dissolutions down the line, so insolvencies could be viewed as a leading indicator of what is to come (recall though that insolvencies are only a small fraction of total exits). While insolvencies were mostly concentrated in small companies directly after Covid, they have spread to larger firms over the course of 2023. Even individual insolvencies can have a significant impact in debt and employment space when concerning large companies, exacerbating any resulting macroeconomic impacts. So far, Chart 5 shows that the share of total employment and debt at risk because associated with firms going insolvent, for a sample of UK medium/large firms we have data for, has evolved within recent historical bounds.
In addition, around half of medium/large firm insolvencies in 2023 comprised administrations – a special type of insolvency designed to stave off liquidation. Analysis on 2016–19 data shows that around 70% of administrations managed to avoid liquidation altogether. Though some employment losses are realised throughout the administration process, this does so far suggest the total impact of insolvencies could be limited
Chart 5: Debt and employment associated with large and medium corporate insolvencies, a share of total debt

Sources: Gazette and Bureau van Dijk FAME.
Note: Analysis is done on a sample of medium and large UK firms and includes administrations. Note that the charts depict debt and employment associated with each company when it was trading, not to debt and employment lost following an insolvency.
Firm exit has been rising following the Covid-19 pandemic. We uncover dissolving firms’ characteristics to understand recent trends. The data suggest that much of the rise in dissolutions, including that in insolvencies reflected a catch-up to pre-Covid trends and exits so far are concentrated in small firms with a limited macroeconomic impact. But this picture could change as the cumulative effects of Covid and higher input prices weigh on corporate balance sheets (as discussed in the February 2024 MPR). In addition, historical analysis suggests that an increase in interest rates can lead to a rising number of firm failures as overall economic activity slows (see Hamano and Zanetti (2022), on US data). More work is needed to understand the implications of these factors for firm exits in this unprecedented episode for UK corporates and what their macroeconomic consequences will be.
Jelle Barkema works in the Bank’s Financial Stability Strategy and Risk Division, Maren Froemel and Sophie Piton work in the Bank’s Monetary Analysis Division.
If you want to get in touch, please email us at bankunderground@bankofengland.co.uk or leave a comment below.
Comments will only appear once approved by a moderator, and are only published where a full name is supplied. Bank Underground is a blog for Bank of England staff to share views that challenge – or support – prevailing policy orthodoxies. The views expressed here are those of the authors, and are not necessarily those of the Bank of England, or its policy committees.
Share the post “Three facts about the rising number of UK business exits”
